

Manufactured Housing Institute (MHI) board member Sun Communities’ (SUI) Q4 and year end 2022 report and data figures are in. Their official statements are found herein in Part I A and B of today’s report. Part I A includes Sun’s official press release. Part I B includes Sun’s earnings call transcript, according to Reuters. Part II will include Additional Information with more MHProNews Analysis and Commentary in Brief. Financial and investment news website, Simply Wall Street reported their topline bullets on Sun Communities (SUI) as follows.
Sun Communities (NYSE:SUI) Full Year 2022 Results
Key Financial Results
- Revenue: US$2.97b (up 32% from FY 2021).
- Net income: US$242.0m (down 36% from FY 2021).
- Profit margin: 8.1% (down from 17% in FY 2021).
- EPS: US$2.01 (down from US$3.36 in FY 2021).
Sun released their Fourth (4th) Quarter 2022 and full year 2022 results and 2023 guidance via GlobeNewswire as follows. Note: highlighting in what follows is added by MHProNews. There are several reasons for highlighting, but one example will help illustrate the point.
Conflicting Public Stances
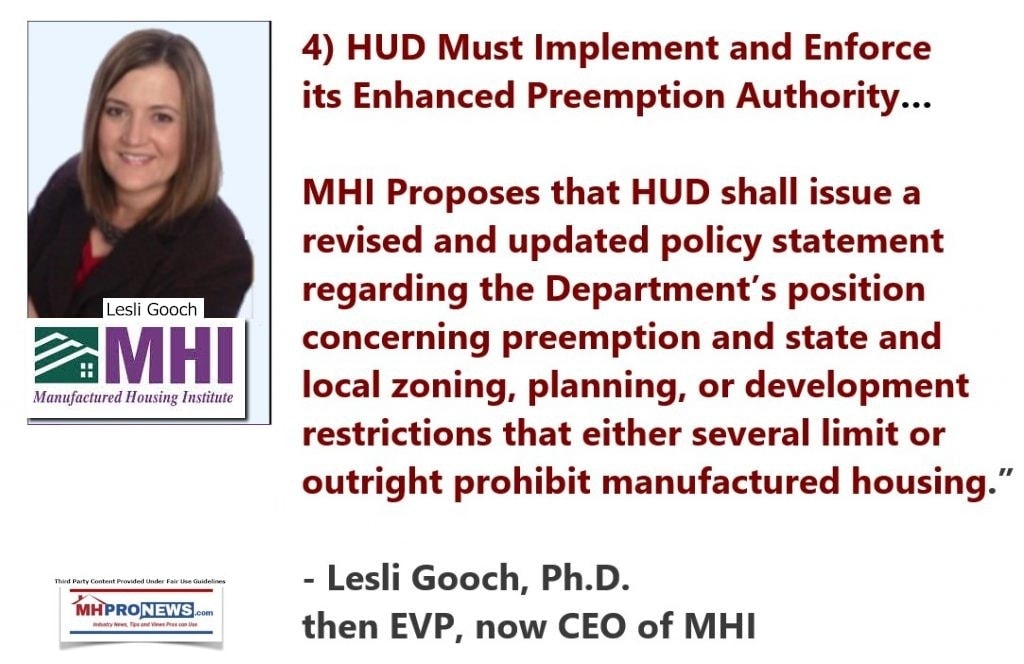
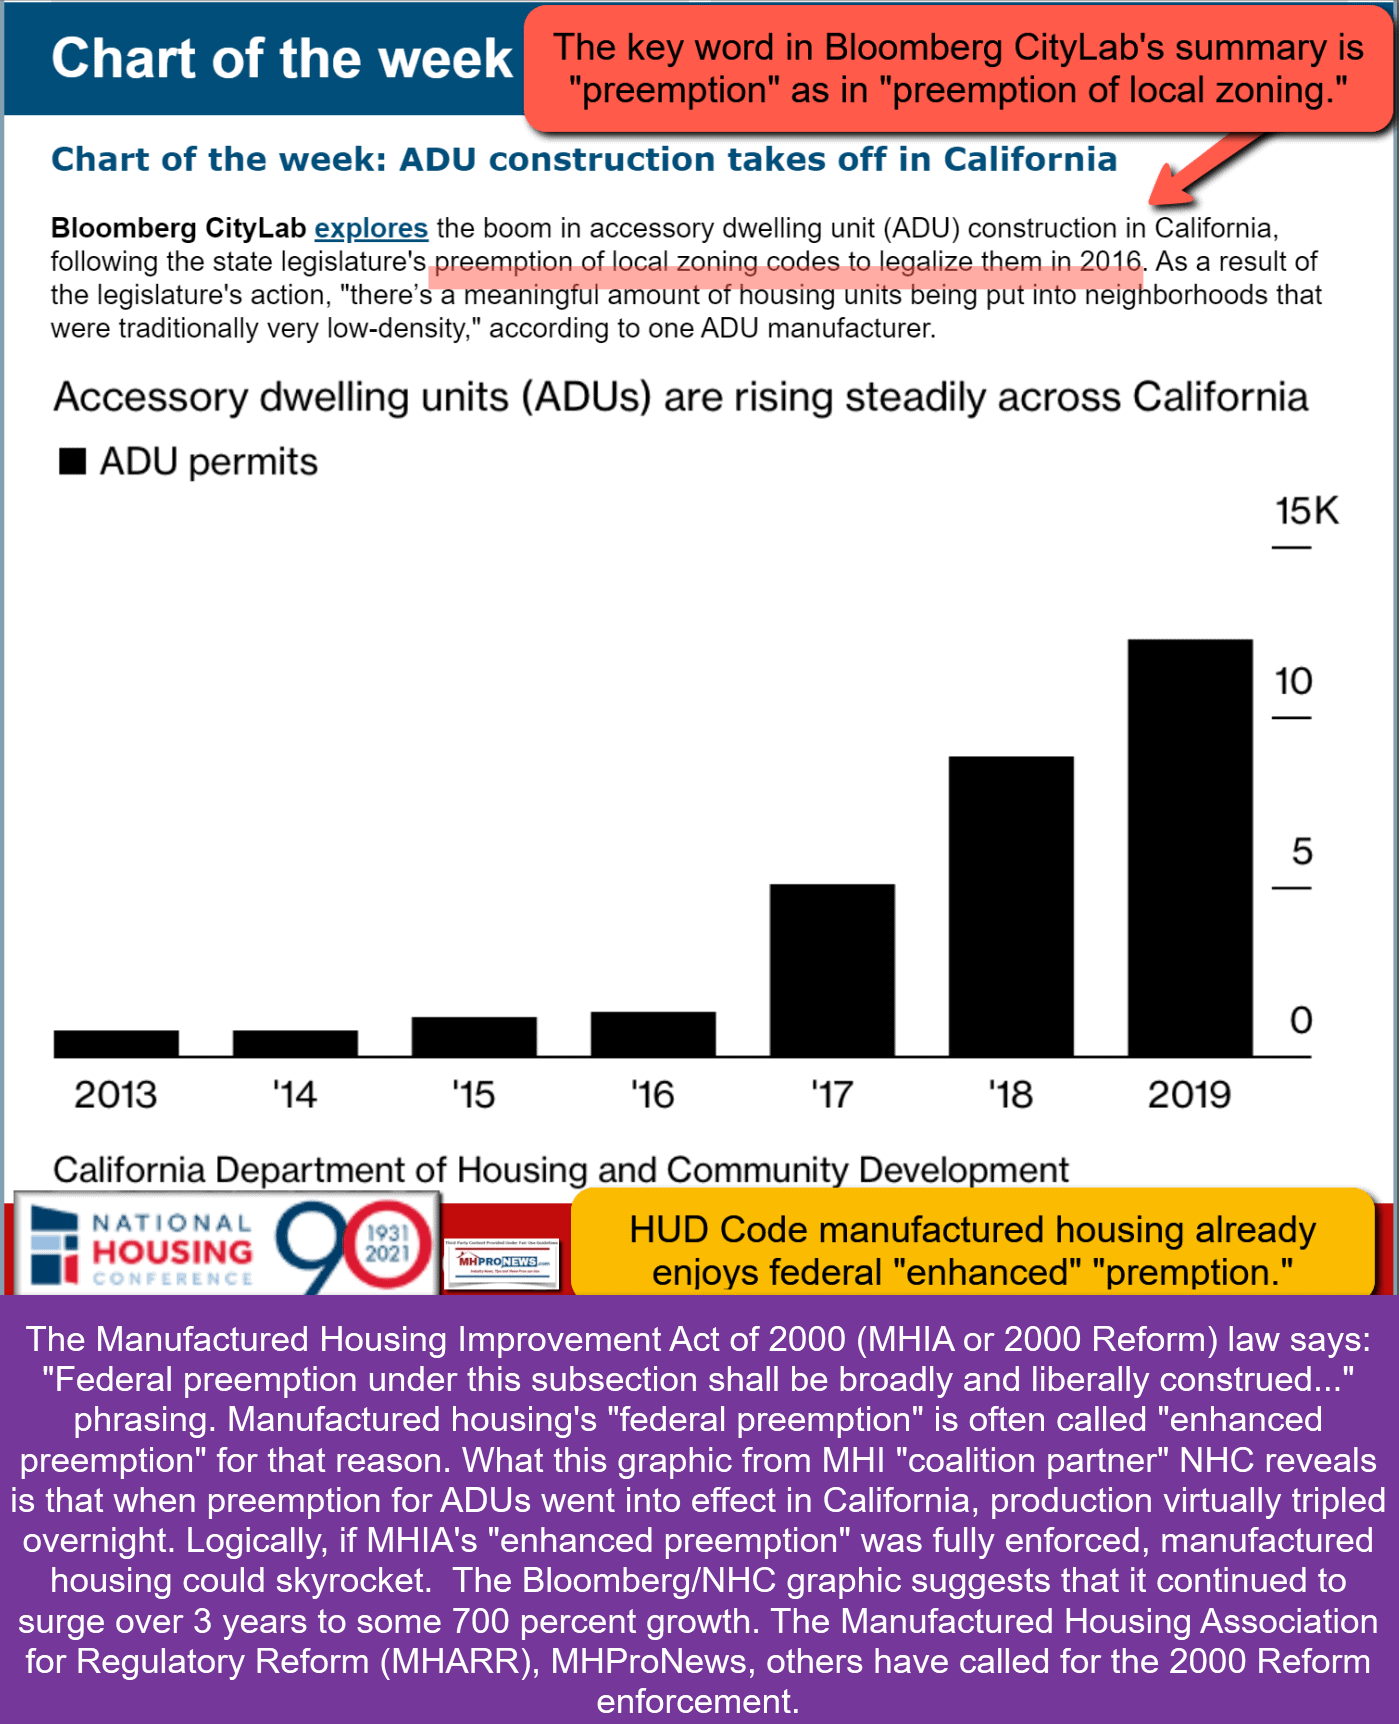
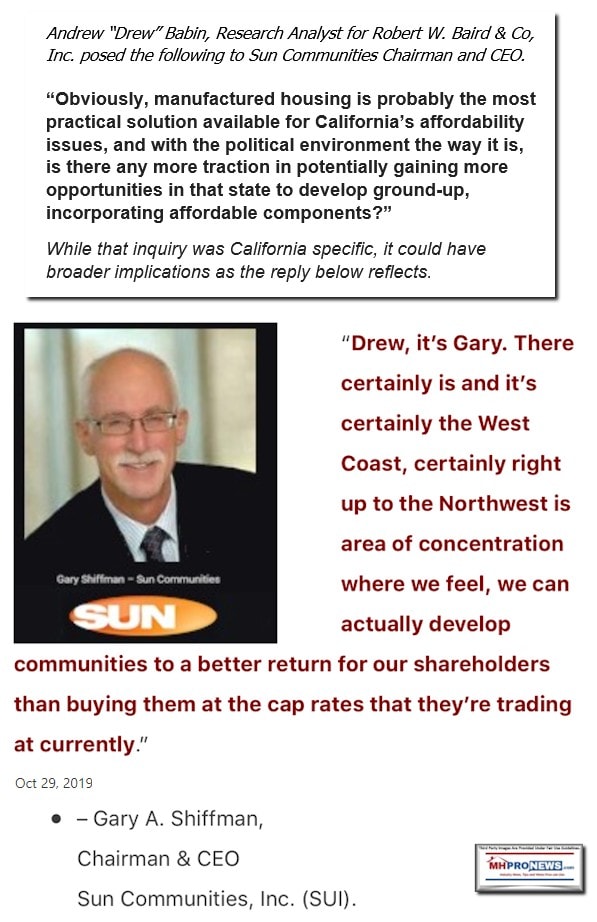
Despite MHI’s VP turned CEO Lesli Gooch’s claim that they want to see the Manufactured Housing Improvement Act of 2000’s (MHIA) “enhanced preemption” provision enforced, by definition, if HUD actually began enforcing that provision and/or local jurisdictions began honoring that part of federal law, then the example from CA indicates that developing and new site placements should dramatically improve. That said, by way of contrast, note this remark by Sun Communities’ Gary A. Shiffman, Chairman and CEO, which is among those highlighted below. “The resilient demand for our manufactured housing…combined with the limited supply…are the foundations of our business model, which generates positive results throughout economic cycles…”
So, when beyond the previously linked remark that MHI’s CEO Lesli Gooch claimed the following in a lightly read comments letter, it would apparently be contrary to Shiffman’s statement about one of the key “foundations” of Sun’s business model. Put simply, Gooch apparently seems to be paltering. There may come a time when MHI will want to vigorously seek to enforce enhanced preemption under the MHIA. But that day has apparently not yet arrived, because there is no known evidence that they or MHI member Sun has sued to get the law enforced.

But there is one more related item that knowledge of Sun’s remarks reflects. Shiffman himself said that there are times it is more cost effective to develop than to purchase an existing manufactured home community. That would be particularly so when cap rates are compressed due to scarcity and demand.
Thus, it appears that it is not only MHI’s Gooch who is paltering. As the expert editorial analysis herein, including in Part II of this article, Sun’s CEO and chairman Shiffman likewise appears to be into the wink and a nod paltering game.
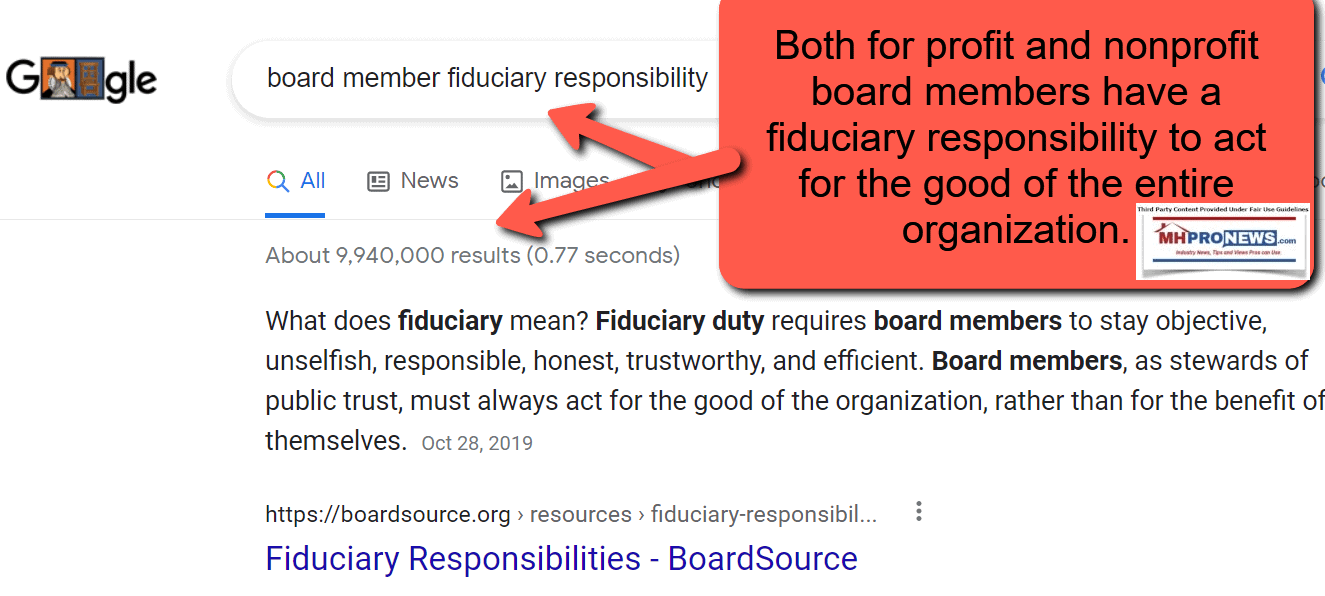
There are ripples of ramifications from such an understanding because Shiffman and Gooch both have fiduciary duties and other legal responsibilities to shareholders and those members or others which authentically desire robust growth. While throttling sales and private lot placements and developing may appear to benefit Sun short term, the case can be made that it will harm the interests of independent retailers and producers of HUD Code manufactured homes. Because this troubling and costly trend has been developing for years, it is no surprise that the numbers of retailers and producers that Congress was told that in the 21st century literally thousands of once profitable businesses being lost.
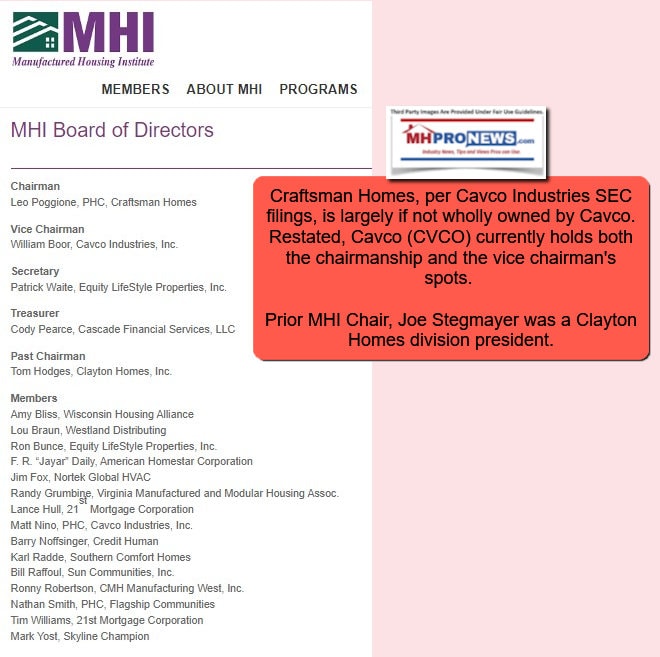
Given that notable legal actions have occurred relative to shareholders and/or stakeholders engaging contingency attorneys because their best interests are not being properly pursued, liability as well as possible federal law violations begin to emerge when specific remarks by MHI members, relevant facts and legalities are laid out like puzzle pieces waiting to be fitted together. While the SEC’s legal action against MHI member Cavco Industries (CVCO) began during the Trump Administration, there are reasons to think that Trump Admin II could be just over the horizon. Hypothesizing legal actions brought against Sun for such arguably avoidable causes of action would obviously have various avenues of defense for the firm. That noted, there appears to be a significant number of winks, nods, and carefully coded comments expressed by Sun and others in MHVille who routinely happen to be MHI members.
So, Sun, Cavco, and other larger consolidating MHI members often seem to fit that paltering, posturing mode that could raise serious civil and possible criminal legal issues for their firm? According to third-party legal and other credible research, the answer to that scenario appears to be “yes.”
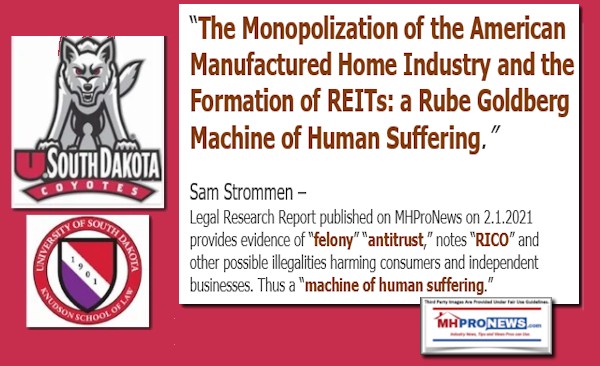
Note that in the remarks and cited data below, Sun’s velocity for adding new sites has slowed significantly in 2022 vs. 2021. In fairness, this is not only true of Sun, but it appears to be occurring among some other MHI member consolidators too. MHProNews plans a report in the near term that reflects another REIT that could be setting themselves up for legal liability for similar reasons to those outlined herein. Collusion and market manipulation are not legal. That may shed light for those with eyes to see on why manufactured housing is underperforming during an affordable housing crisis.
Against that factual, evidence-based, and industry expert views backdrop, what follows is from Sun’s media release, with highlighting added by MHProNews.
Part 1 A
Sun Communities, Inc. Reports 2022 Fourth Quarter and Full Year Results; Provides 2023 Guidance and Increases Annual Distribution Rate for 2023
February 22, 2023 16:41 ET | Source: Sun Communities, Inc.
Net Income per Diluted Share of $0.04 and $2.00 for the Quarter and Year End, Respectively
Core FFO(1) per Share of $1.33 and $7.35 for the Quarter and Year End,
Respectively, Increased 1.5% and 12.9% over the 2021 Periods
Strong Demand and Accretive Investments Drive Continued Solid Performance
Record Volume of Transient-to-Annual RV Conversions Propel Record Gains in Revenue Producing Sites
Establishing Guidance for 2023
Expecting Total Same Property NOI(1)(2) Growth of 4.9% – 5.9%
Increasing Annual Distribution by 5.7% in 2023, to $3.72 per share
Southfield, MI, Feb. 22, 2023 (GLOBE NEWSWIRE) — Sun Communities, Inc. (NYSE: SUI) (the “Company” or “SUI”), a real estate investment trust (“REIT”) that owns and operates, or has an interest in, manufactured housing (“MH”) and recreational vehicle (“RV”) communities and marinas (collectively, the “properties”), today reported its fourth quarter and full-year results for 2022.
Financial Results for the Quarter and Year Ended December 31, 2022
- For the quarter ended December 31, 2022, net income attributable to common shareholders was $4.7 million, or $0.04 per diluted share, compared to net income attributable to common shareholders of $12.9 million, or $0.11 per diluted share, for the same period in 2021.
- For the year ended December 31, 2022, net income attributable to common shareholders was $242.0 million, or $2.00 per diluted share, compared to net income attributable to common shareholders of $380.2 million, or $3.36 per diluted share, for the same period in 2021.
Non-GAAP Financial Measures
- Core Funds from Operations (“Core FFO”)(1) for the quarter and year ended December 31, 2022, was $1.33 per common share and dilutive convertible securities (“Share”) and $7.35 per Share, respectively, representing 1.5% and 12.9% increases as compared to the corresponding periods in 2021.
- Constant Currency Core Funds from Operations (“Constant Currency Core FFO”)(1) for the quarter and year ended December 31, 2022, was $1.34 per Share and $7.44 per Share, respectively.
- Same Property Net Operating Income (“NOI”)(1)(2) for MH and RV properties increased by 4.4% and 5.4% for the quarter and year ended December 31, 2022, respectively, as compared to the corresponding periods in 2021. For the Company’s Marina properties, Same Property NOI(1) increased by 10.4% and 7.7% for the quarter and year ended December 31, 2022, respectively, as compared to the corresponding periods in 2021.
“We are pleased to report another year of strong performance and earnings growth. The resilient demand for our manufactured housing, RV and marina properties, combined with the limited supply for each, are the foundations of our business model, which generates positive results throughout economic cycles,” said Gary A. Shiffman, Chairman and CEO. “We delivered a record number of revenue producing sites in 2022, primarily driven by record conversions to annual leases at our RV communities, and we have nearly 16,200 sites in our portfolio available for development. We are optimistic in our outlook for 2023, supported by our healthy rental rate increases in our MH, annual RV and Marina properties. We will be disciplined in terms of capital deployment, pursuing selective acquisition opportunities while continuing to leverage our development platform to create new supply to meet the strong demand and deliver value for our shareholders.”
OPERATING HIGHLIGHTS
Portfolio Occupancy
- Total MH and annual RV occupancy (excluding UK Operations) was 96.8% at December 31, 2022, as compared to 97.4% at December 31, 2021.
- Revenue Producing Sites Gains – During the quarter ended December 31, 2022, the number of MH and annual RV revenue producing sites increased by 613 sites, as compared to an increase of 810 sites during the corresponding period in 2021. During the year ended December 31, 2022, MH and annual RV revenue producing sites increased by 2,922 sites, a 17.7% increase over the 2,483 sites gained during 2021.
- Transient-to-annual RV site conversions totaled a record 2,257 sites in 2022, and accounted for 77.2% of 2022’s revenue producing site gains.
Same Property Results(2)
- MH and RV – For the 421 MH and RV properties owned and operated by the Company since at least January 1, 2021, the following table reflects the percentage changes, both in total and by segment, for the quarter and year ended December 31, 2022:
| Quarter Ended December 31, 2022 | ||||||||
| Total MH and RV Same Property(2) |
MH Same Property(2) |
RV Same Property(2) |
||||||
| Revenue | 4.9 | % | 4.7 | % | 5.3 | % | ||
| Expense | 5.8 | % | 12.0 | % | (0.9) % | |||
| NOI(1) | 4.4 | % | 2.2 | % | 11.8 | % | ||
| Year Ended December 31, 2022 | ||||||||
| Total MH and RV Same Property(2) | MH Same Property(2) |
RV Same Property(2) |
||||||
| Revenue | 5.7 | % | 4.5 | % | 7.6 | % | ||
| Expense | 6.2 | % | 8.1 | % | 4.2 | % | ||
| NOI(1) | 5.4 | % | 3.3 | % | 10.3 | % | ||
Same Property adjusted blended occupancy(3) increased to 98.6% at December 31, 2022, from 96.8% at December 31, 2021, an increase of 180 basis points.
- Marina – For the 101 Marina properties owned and operated by the Company since at least January 1, 2021, the following table reflects the percentage increases for the quarter and year ended December 31, 2022:
| Quarter Ended December 31, 2022 | Year Ended December 31, 2022 | ||||
| Revenue | 8.2 | % | 7.0 | % | |
| Expense | 4.2 | % | 5.8 | % | |
| NOI(1) | 10.4 | % | 7.7 | % | |
UK Operations Results
During 2022, the Company expanded its MH segment into the United Kingdom (“UK”) with the acquisition of Park Holidays, the second largest owner and operator of holiday parks in the UK. UK Operations contributed $23.3 million of NOI(1) in the quarter ended December 31, 2022, and contributed $128.3 million of NOI(1) in the period from date of acquisition to December 31, 2022. On a constant currency basis, UK Operations contributed $27.0 million of NOI(1) in the quarter ended December 31, 2022, and contributed $143.9 million of NOI(1) in the period from date of acquisition to December 31, 2022. Refer to page 13 for additional information regarding UK operating results.
Hurricane Ian Update
As previously announced, the Company’s properties in Florida sustained damage from Hurricane Ian in September 2022. Complete asset impairments occurred at three communities in the Fort Myers area, which will require redevelopment. Charges, net of expected insurance recoveries, of $17.3 million were recognized as “Catastrophic event-related charges, net” in the Consolidated Statements of Operations for the year ended December 31, 2022. After quarter end, the Company received a reimbursement from its insurer for $3.5 million related to losses from debris and tree removal, common area repairs and flooding damage.
The foregoing estimates are based on current information available, and the Company continues to assess these estimates. The actual final impairment, insurance recoveries and net charges could vary from these estimates. Any changes to these estimates will be recognized in the period(s) in which they are determined.
INVESTMENT ACTIVITY
Acquisitions
Acquisitions totaled $66.7 million during the quarter ended December 31, 2022, including one MH community, one RV community and two marinas in the United States and one MH community in the UK. Refer to page 17 for additional detail on acquisitions and dispositions.
Development and Expansion Activities
During the year ended December 31, 2022, the Company:
- Acquired six land parcels located in the United States and UK for the potential development of over 1,300 sites, for an aggregate purchase price of $26.2 million.
- Constructed over 270 sites in the fourth quarter, bringing the total for the year to more than 840 sites at six ground-up development properties. This includes over 445 sites at two development properties acquired in the second quarter.
- Expanded existing communities by nearly 980 sites, bringing the total for the year to nearly 1,160 sites at 11 expansion properties.
BALANCE SHEET, CAPITAL MARKETS ACTIVITY AND OTHER ITEMS
Debt
As of December 31, 2022, the Company had $7.2 billion in debt outstanding with a weighted average interest rate of 3.8% and a weighted average maturity of 7.4 years. At December 31, 2022, the Company’s net debt to trailing twelve-month Recurring EBITDA(1) ratio was 6.0 times.
During and subsequent to the quarter ended December 31, 2022, the Company completed previously announced secured financings on 23 properties that raised proceeds of $311.0 million. The loans mature between February 13, 2026 and December 15, 2029 and have fixed interest rates of 4.5% to 5.0%. The Company used the proceeds to repay borrowings outstanding under its senior credit facility.
Subsequent to the quarter ended December 31, 2022, the Company issued $400.0 million of senior unsecured notes with an interest rate of 5.7% and a 10-year term. The Company used net proceeds of $395.3 million, to repay borrowings outstanding under its unsecured revolving line of credit.
2023 Distributions
The Company’s Board of Directors has approved setting the 2023 annual distribution rate at $3.72 per common share and unit, an increase of $0.20, or 5.7%, over the current annual dividend rate of $3.52 per common share and unit for 2022. This increase will begin with the first quarter distribution to be paid in April 2023. While the Board of Directors has adopted the new annual distribution policy, the amount of each quarterly distribution on the Company’s common stock will be subject to approval by the Board of Directors.
2023 GUIDANCE
Establishing Full-Year and First Quarter 2023 Guidance
The Company is establishing full-year and first quarter 2023 guidance for diluted EPS and Core FFO(1) per Share as follows:
| Reconciliation of Diluted EPS to Core FFO(1) per Share | First Quarter Ending March 31, 2023 |
Full-Year Ending December 31, 2023 |
||||||||||||||
| Low | High | Low | High | |||||||||||||
| Diluted EPS | $ | (0.03 | ) | $ | 0.02 | $ | 2.50 | $ | 2.70 | |||||||
| Depreciation and amortization | 1.24 | 1.24 | 5.02 | 5.02 | ||||||||||||
| Gain on sale of assets | (0.07 | ) | (0.07 | ) | (0.32 | ) | (0.32 | ) | ||||||||
| FFO(1) per Share | $ | 1.14 | $ | 1.19 | $ | 7.20 | $ | 7.40 | ||||||||
| Business combination expense and other acquisition related costs | 0.01 | 0.01 | 0.03 | 0.03 | ||||||||||||
| Other adjustments(a) | — | — | (0.01 | ) | (0.01 | ) | ||||||||||
| Core FFO(1)(b) per Share | $ | 1.15 | $ | 1.20 | $ | 7.22 | $ | 7.42 | ||||||||
(a) Other adjustments include the same categories presented in the table that reconciles Net income attributable to SUI common shareholders to FFO on page 6.
(b) The Company’s initial guidance translates forecasted results from operations in Canada, Australia and the UK using the relevant exchange rates in effect on December 31, 2022, which are provided in the 2023 Guidance Assumptions for Consolidated Portfolio table.
| 2023 Guidance Assumptions for Consolidated Portfolio | ||||
| Expected % | ||||
| Total Expected NOI(1) from Real Property: | Change in 2023 | |||
| Revenues | ||||
| Real property (excluding transient) | 9.8% – 10.2% | |||
| Real property (transient) | 0.9% – 2.1% | |||
| Revenues from real property | 8.1% – 8.7% | |||
| Total property operating expenses | 13.5% – 13.9% | |||
| Total NOI(1) from real property | 4.5% – 5.7% | |||
| Expected Ranges: | (in millions) | |||
| Service, retail, dining and entertainment NOI(1) | $49.5 – $52.1 | |||
| Interest income, brokerage commissions and other revenues, net | $82.6 – $84.8 | |||
| General and administrative expenses | $256.5 – $261.6 | |||
| UK Operations: | ||||
| NOI(1) from real property and home sales(a) | $155.5 – $165.1 | |||
| Other MH / RV Operational Guidance – North America: | # of sites | |||
| Increase in revenue producing sites | 2,800 – 3,100 | |||
| Vacant site additions from expansions and ground-up developments | 1,000 – 1,300 | |||
| Exchange rates in effect at: | December 31, 2022 | |||
| U.S. Dollar (“USD”) / Pound Sterling (“GBP”) | 1.21 | |||
| USD / Canadian Dollar (“CAD”) | 0.74 | |||
| USD / Australian Dollar (“AUS”) | 0.68 | |||
(a) UK NOI(1) from real property is included in Total NOI(1) from real property.
The Company expects total Same Property NOI(1) to increase 4.9% – 5.9% during the year ending December 31, 2023, inclusive of 3.3% – 4.4% total Same Property NOI(1) growth during the first quarter ending March 31, 2023.
| 2023 Guidance Assumptions for Same Property(1)(a) Portfolio | FY 2022 (in millions) |
Expected % Change in 2023 |
|||
| MH NOI(1) (289 properties) | $ | 570.3 | 4.2% – 5.0% | ||
| RV NOI(1) (163 properties) | $ | 281.0 | 5.1% – 6.4% | ||
| Marina NOI(1) (120 properties) | $ | 217.0 | 6.3% – 7.7% | ||
| Total Same Property Portfolio (572 properties) | |||||
| Income from real property(b) | $ | 1,608.9 | 6.6% – 7.0% | ||
| Total property operating expenses(b)(c) | $ | 540.6 | 9.1% – 10.0% | ||
| NOI(1) | $ | 1,068.3 | 4.9% – 5.9% | ||
| 2023 Average Rental Rate Increases: | Guidance(d) | ||||
| MH | 6.2% – 6.4% | ||||
| Annual RV | 7.7% – 7.9% | ||||
| Marina | 7.3% – 7.6% | ||||
| MH – UK Operations | 7.2% – 7.4% | ||||
(a) The amounts in the table reflect constant currency, as Canadian currency figures included within the 2022 actual amounts have been translated at the assumed exchange rate used for 2023 guidance.
(b) Total Same Property results net $101.3 million and $105.5 million of utility revenue against the related utility expense in property operating expenses for 2022 actual results and 2023 guidance, respectively.
(c) FY 2022 results exclude $1.3 million of expense incurred at recently acquired properties in order to bring them up to the Company’s operating standards. The improvements included items such as tree trimming and painting costs that do not meet the Company’s capitalization policy.
(d) Rental rate guidance for 2023 is unchanged from the ranges provided by the Company in its third quarter 2022 supplemental information package.
| Seasonality | 1Q23 | 2Q23 | 3Q23 | 4Q23 | ||||||||
| Same Property NOI(1) | ||||||||||||
| MH | 25 | % | 25 | % | 25 | % | 25 | % | ||||
| RV | 15 | % | 26 | % | 42 | % | 17 | % | ||||
| Marina | 19 | % | 27 | % | 30 | % | 24 | % | ||||
| Total Same Property | 21 | % | 26 | % | 30 | % | 23 | % | ||||
| NOI(1) from UK Operations | 16 | % | 29 | % | 38 | % | 17 | % | ||||
| Consolidated EBITDA(1) | 19 | % | 27 | % | 33 | % | 21 | % | ||||
| Core FFO(1) per Share | 16 | % | 27 | % | 36 | % | 21 | % | ||||
The estimates and assumptions presented above represent a range of possible outcomes and may differ materially from actual results. These estimates include contributions from all acquisitions, dispositions and capital markets activity completed through February 22, 2023, and the effect of a property disposition under contract expected to close in March 2023. These estimates exclude all other prospective acquisitions, dispositions and capital markets activity. The estimates and assumptions are forward-looking based on the Company’s current assessment of economic and market conditions and are subject to the other risks outlined below under the caption Cautionary Statement Regarding Forward-Looking Statements.
EARNINGS CONFERENCE CALL
A conference call to discuss fourth quarter results will be held on Thursday, February 23, 2023 at 11:00 A.M. (ET). To participate, call toll-free at (877) 407-9039. Callers outside the U.S. or Canada can access the call at (201) 689-8470. A replay will be available following the call through March 9, 2023 and can be accessed toll-free by calling (844) 512-2921 or (412) 317-6671. The Conference ID number for the call and the replay is 13734720. The conference call will be available live on the Company’s website located at www.suncommunities.com. The replay will also be available on the website.
CAUTIONARY STATEMENT REGARDING FORWARD-LOOKING STATEMENTS
This press release contains various “forward-looking statements” within the meaning of the Securities Act of 1933, as amended (the “Securities Act”), and the Securities Exchange Act of 1934, as amended (the “Exchange Act”), and the Company intends that such forward-looking statements will be subject to the safe harbors created thereby. For this purpose, any statements contained in this document that relate to expectations, beliefs, projections, future plans and strategies, trends or prospective events or developments and similar expressions concerning matters that are not historical facts are deemed to be forward-looking statements. Words such as “forecasts,” “intends,” “intend,” “intended,” “goal,” “estimate,” “estimates,” “expects,” “expect,” “expected,” “project,” “projected,” “projections,” “plans,” “predicts,” “potential,” “seeks,” “anticipates,” “anticipated,” “should,” “could,” “may,” “will,” “designed to,” “foreseeable future,” “believe,” “believes,” “scheduled,” “guidance,” “target” and similar expressions are intended to identify forward-looking statements, although not all forward-looking statements contain these words. These forward-looking statements reflect the Company’s current views with respect to future events and financial performance, but involve known and unknown risks and uncertainties, both general and specific to the matters discussed in this document, some of which are beyond the Company’s control. These risks and uncertainties may cause the Company’s actual results to be materially different from any future results expressed or implied by such forward-looking statements. In addition to the risks described under “Risk Factors” contained in the Company’s Annual Report on Form 10-K for the year ended December 31, 2021 and in the Company’s other filings with the Securities and Exchange Commission from time to time, such risks, uncertainties and other factors include but are not limited to:
- Outbreaks of disease and related restrictions on business operations;
- Changes in general economic conditions, including inflation, deflation and energy costs, the real estate industry and the markets within which the Company operates;
- Difficulties in the Company’s ability to evaluate, finance, complete and integrate acquisitions, developments and expansions successfully;
- The Company’s liquidity and refinancing demands;
- The Company’s ability to obtain or refinance maturing debt;
- The Company’s ability to maintain compliance with covenants contained in its debt facilities and its unsecured notes;
- Availability of capital;
- Changes in foreign currency exchange rates, including between the U.S. dollar and each of the Canadian dollar, Australian dollar and Pound sterling;
- The Company’s ability to maintain rental rates and occupancy levels;
- The Company’s ability to maintain effective internal control over financial reporting and disclosure controls and procedures;
- Increases in interest rates and operating costs, including insurance premiums and real estate taxes;
- Risks related to natural disasters such as hurricanes, earthquakes, floods, droughts and wildfires;
- General volatility of the capital markets and the market price of shares of the Company’s capital stock;
- The Company’s ability to maintain its status as a REIT;
- Changes in real estate and zoning laws and regulations;
- Legislative or regulatory changes, including changes to laws governing the taxation of REITs;
- Litigation, judgments or settlements;
- Competitive market forces;
- The ability of purchasers of manufactured homes and boats to obtain financing; and
- The level of repossessions by manufactured home and boat lenders.
Readers are cautioned not to place undue reliance on these forward-looking statements, which speak only as of the date the statement was made. The Company undertakes no obligation to publicly update or revise any forward-looking statements included or incorporated by reference into this document, whether as a result of new information, future events, changes in the Company’s expectations or otherwise, except as required by law.
Although the Company believes that the expectations reflected in the forward-looking statements are reasonable, the Company cannot guarantee future results, levels of activity, performance or achievements. All written and oral forward-looking statements attributable to the Company or persons acting on the Company’s behalf are qualified in their entirety by these cautionary statements.
Company Overview and Investor Information
The Company
Established in 1975, Sun Communities, Inc. became a publicly owned corporation in December 1993. The Company is a fully integrated REIT listed on the New York Stock Exchange under the symbol: SUI. As of December 31, 2022, the Company owned, operated, or had an interest in a portfolio of 669 developed MH, RV and Marina properties comprising over 179,700 developed sites and approximately 47,800 wet slips and dry storage spaces in the United States, the United Kingdom and Canada.
For more information about the Company, please visit www.suncommunities.com.
| Company Contacts | |
| Management: | Investor Relations: |
|
Sara Ismail, Vice President |
|
(248) 208-2500 |
|
investorrelations@suncommunities.com |
| Corporate Debt Ratings | |
| Moody’s | S&P: |
| Baa3 | Stable | BBB | Stable |
| Equity Research Coverage | ||||
| Bank of America Merrill Lynch | Joshua Dennerlein | joshua.dennerlein@bofa.com | ||
| Barclays | Anthony Powell | anthony.powell@barclays.com | ||
| BMO Capital Markets | John Kim | jp.kim@bmo.com | ||
| Citi Research | Nicholas Joseph | nicholas.joseph@citi.com | ||
| Evercore ISI | Samir Khanal | samir.khanal@evercoreisi.com | ||
| Steve Sakwa | steve.sakwa@evercoreisi.com | |||
| Green Street Advisors | John Pawlowski | jpawlowski@greenstreetadvisors.com | ||
| JMP Securities | Aaron Hecht | ahecht@jmpsecurities.com | ||
| RBC Capital Markets | Brad Heffern | brad.heffern@rbccm.com | ||
| Robert W. Baird & Co. | Wesley Golladay | wgolladay@rwbaird.com | ||
| Truist Securities | Anthony Hau | anthony.hau@truist.com | ||
| UBS | Michael Goldsmith | michael.goldsmith@ubs.com | ||
| Wolfe Research | Andrew Rosivach | arosivach@wolferesearch.com | ||
| Keegan Carl | kcarl@wolferesearch.com |
Financial and Operating Highlights
(amounts in millions, except for *)
| Quarter Ended | ||||||||||||||
| 12/31/2022 | 9/30/2022 | 6/30/2022 | 3/31/2022 | 12/31/2021 | ||||||||||
| Financial Information | ||||||||||||||
| Basic Earnings per share (“EPS”)* | $ | 0.04 | $ | 1.32 | $ | 0.61 | $ | 0.01 | $ | 0.11 | ||||
| Diluted EPS* | $ | 0.04 | $ | 1.32 | $ | 0.61 | $ | 0.01 | $ | 0.11 | ||||
| Cash distributions declared per common share* | $ | 0.88 | $ | 0.88 | $ | 0.88 | $ | 0.88 | $ | 0.83 | ||||
| FFO(1)(4) per Share* | $ | 1.02 | $ | 2.54 | $ | 1.95 | $ | 1.28 | $ | 1.28 | ||||
| Core FFO(1)(4) per Share* | $ | 1.33 | $ | 2.65 | $ | 2.02 | $ | 1.34 | $ | 1.31 | ||||
| Constant Currency Core FFO(1)(4) per Share* | $ | 1.34 | $ | 2.71 | $ | 2.04 | $ | 1.34 | $ | 1.31 | ||||
| Recurring EBITDA(1) | $ | 236.3 | $ | 408.1 | $ | 328.4 | $ | 221.0 | $ | 208.6 | ||||
| Recurring EBITDA(1) (TTM) / Interest | 5.2x | 5.7x | 5.9x | 6.2x | 6.2x | |||||||||
| Balance Sheet | ||||||||||||||
| Total assets | $ | 17,084.2 | $ | 16,484.6 | $ | 16,397.8 | $ | 13,914.2 | $ | 13,494.1 | ||||
| Total debt | $ | 7,197.2 | $ | 6,711.0 | $ | 6,930.9 | $ | 6,076.5 | $ | 5,671.8 | ||||
| Total liabilities | $ | 8,992.8 | $ | 8,354.6 | $ | 8,566.3 | $ | 6,980.7 | $ | 6,474.6 | ||||
| Operating Information* | ||||||||||||||
| Properties | ||||||||||||||
| MH | 353 | 350 | 349 | 293 | 292 | |||||||||
| RV | 182 | 181 | 182 | 182 | 185 | |||||||||
| Marina | 134 | 131 | 130 | 128 | 125 | |||||||||
| Total | 669 | 662 | 661 | 603 | 602 | |||||||||
| United States and Canada | ||||||||||||||
| Manufactured home sites | 99,977 | 99,428 | 99,185 | 98,279 | 98,621 | |||||||||
| Annual RV sites | 30,333 | 32,026 | 31,768 | 31,121 | 30,540 | |||||||||
| Transient RV sites | 28,038 | 27,945 | 28,682 | 29,267 | 29,847 | |||||||||
| Total sites | 158,348 | 159,399 | 159,635 | 158,667 | 159,008 | |||||||||
| Marina wet slips and dry storage spaces(a) | 47,823 | 46,185 | 45,905 | 45,725 | 45,155 | |||||||||
| MH occupancy | 95.9 | % | 96.2 | % | 96.3 | % | 96.7 | % | 96.6 | % | ||||
| Annual RV occupancy | 100.0 | % | 100.0 | % | 100.0 | % | 100.0 | % | 100.0 | % | ||||
| Blended MH and annual RV occupancy | 96.8 | % | 97.1 | % | 97.2 | % | 97.5 | % | 97.4 | % | ||||
| United Kingdom | ||||||||||||||
| Manufactured home sites | 18,227 | 17,733 | 17,112 | 616 | N/A | |||||||||
| Transient RV sites | 3,143 | 3,203 | 3,306 | — | N/A | |||||||||
| Total sites | 21,370 | 20,936 | 20,418 | 616 | — | |||||||||
| MH occupancy | 89.0 | % | 91.7 | % | 91.4 | % | 94.8 | % | N/A | |||||
| MH and RV Revenue Producing Site Net Gains(5)* (excluding UK Operations) |
|||||||||
| MH net leased sites | 346 | 122 | 132 | 65 | 321 | ||||
| RV net leased sites | 267 | 567 | 818 | 605 | 489 | ||||
| Total net leased sites | 613 | 689 | 950 | 670 | 810 |
(a) Total wet slips and dry storage spaces are adjusted each quarter based on site configuration and usability.
Portfolio Overview as of December 31, 2022
| MH & RV Properties | |||||||||||||
| Properties | MH & Annual RV | RV Transient Sites | Total MH and RV Sites | Sites for Development(b) | |||||||||
| Location | Sites | Occupancy %(a) | |||||||||||
| Florida | 129 | 39,618 | 97.4 | % | 4,660 | 44,278 | 3,539 | ||||||
| Michigan | 84 | 32,471 | 96.7 | % | 749 | 33,220 | 1,337 | ||||||
| California | 37 | 6,861 | 98.6 | % | 1,936 | 8,797 | 942 | ||||||
| Texas | 31 | 8,778 | 94.3 | % | 2,566 | 11,344 | 2,015 | ||||||
| Ontario, Canada | 16 | 4,611 | 100.0 | % | 628 | 5,239 | 1,473 | ||||||
| Connecticut | 16 | 1,907 | 93.4 | % | 98 | 2,005 | — | ||||||
| Maine | 16 | 2,548 | 95.1 | % | 1,108 | 3,656 | 202 | ||||||
| Arizona | 13 | 4,537 | 91.3 | % | 986 | 5,523 | 6 | ||||||
| Indiana | 12 | 3,155 | 96.6 | % | 1,023 | 4,178 | 177 | ||||||
| New Jersey | 11 | 2,817 | 100.0 | % | 1,225 | 4,042 | 262 | ||||||
| Colorado | 11 | 2,799 | 88.2 | % | 987 | 3,786 | 1,493 | ||||||
| Virginia | 10 | 1,286 | 99.8 | % | 2,163 | 3,449 | 752 | ||||||
| New York | 10 | 1,497 | 98.5 | % | 1,443 | 2,940 | 778 | ||||||
| New Hampshire | 10 | 1,728 | 100.0 | % | 652 | 2,380 | 111 | ||||||
| Other | 74 | 15,697 | 97.9 | % | 7,814 | 23,511 | 1,220 | ||||||
| North America Total | 480 | 130,310 | 96.8 | % | 28,038 | 158,348 | 14,307 | ||||||
| United Kingdom | 55 | 18,227 | 89.0 | % | 3,143 | 21,370 | 1,888 | ||||||
| Total | 535 | 148,537 | 95.9 | % | 31,181 | 179,718 | 16,195 | ||||||
(a) As of December 31, 2022, total portfolio MH occupancy was 94.8% inclusive of the impact of over 2,300 recently constructed but vacant MH expansion sites, and annual RV occupancy was 100.0%.
(b) Total sites for development were comprised of 54% for expansion, 25% for greenfield development and 21% for redevelopment.
| Marina | ||||||||
| Properties | Wet Slips and Dry Storage Spaces | |||||||
| Location | ||||||||
| Florida | 21 | 5,054 | ||||||
| Rhode Island | 12 | 3,421 | ||||||
| Connecticut | 11 | 3,325 | ||||||
| California | 11 | 5,705 | ||||||
| New York | 9 | 3,018 | ||||||
| Maryland | 9 | 2,632 | ||||||
| Massachusetts | 9 | 2,520 | ||||||
| Other | 52 | 22,148 | ||||||
| Total | 134 | 47,823 | ||||||
| Properties | Sites, Wet Slips and Dry Storage Spaces | |||||||
| Total Portfolio | 669 | 227,541 |
Consolidated Balance Sheets
(amounts in millions)
| December 31, 2022 | December 31, 2021 | ||||||
| Assets | |||||||
| Land | $ | 4,322.3 | $ | 2,556.3 | |||
| Land improvements and buildings | 10,903.4 | 9,958.3 | |||||
| Rental homes and improvements | 645.2 | 591.7 | |||||
| Furniture, fixtures and equipment | 839.0 | 656.4 | |||||
| Investment property | 16,709.9 | 13,762.7 | |||||
| Accumulated depreciation | (2,738.9 | ) | (2,337.2 | ) | |||
| Investment property, net | 13,971.0 | 11,425.5 | |||||
| Cash, cash equivalents and restricted cash | 90.4 | 78.2 | |||||
| Marketable securities | 127.3 | 186.9 | |||||
| Inventory of manufactured homes | 202.7 | 51.1 | |||||
| Notes and other receivables, net | 617.3 | 469.6 | |||||
| Goodwill | 1,018.4 | 495.4 | |||||
| Other intangible assets, net | 402.0 | 306.8 | |||||
| Other assets, net | 655.1 | 480.6 | |||||
| Total Assets | $ | 17,084.2 | $ | 13,494.1 | |||
| Liabilities | |||||||
| Secured debt | $ | 3,217.8 | $ | 3,380.7 | |||
| Unsecured debt | 3,979.4 | 2,291.1 | |||||
| Distributions payable | 111.3 | 98.4 | |||||
| Advanced reservation deposits and rent | 352.1 | 242.8 | |||||
| Accrued expenses and accounts payable | 396.3 | 237.5 | |||||
| Other liabilities | 935.9 | 224.1 | |||||
| Total Liabilities | 8,992.8 | 6,474.6 | |||||
| Commitments and contingencies | |||||||
| Temporary equity | 202.9 | 288.9 | |||||
| Shareholders’ Equity | |||||||
| Common stock | 1.2 | 1.2 | |||||
| Additional paid-in capital | 9,549.7 | 8,175.6 | |||||
| Accumulated other comprehensive income / (loss) | (9.9 | ) | 3.1 | ||||
| Distributions in excess of accumulated earnings | (1,731.2 | ) | (1,556.0 | ) | |||
| Total SUI shareholders’ equity | 7,809.8 | 6,623.9 | |||||
| Noncontrolling interests | |||||||
| Common and preferred OP units | 78.7 | 86.8 | |||||
| Consolidated entities | — | 19.9 | |||||
| Total noncontrolling interests | 78.7 | 106.7 | |||||
| Total Shareholders’ Equity | 7,888.5 | 6,730.6 | |||||
| Total Liabilities, Temporary Equity and Shareholders’ Equity | $ | 17,084.2 | $ | 13,494.1 | |||
Consolidated Statements of Operations
(amounts in millions, except for per share amounts)
| Three Months Ended | Year Ended | ||||||||||||||||||||
| December 31, 2022 | December 31, 2021 | % Change | December 31, 2022 | December 31, 2021 | % Change | ||||||||||||||||
| Revenues | |||||||||||||||||||||
| Real property (excluding transient) | $ | 390.8 | $ | 338.5 | 15.5 | % | $ | 1,548.9 | $ | 1,316.8 | 17.6 | % | |||||||||
| Real property – transient | 49.8 | 45.8 | 8.7 | % | 353.3 | 281.4 | 25.6 | % | |||||||||||||
| Home sales | 107.7 | 65.1 | 65.4 | % | 465.8 | 280.2 | 66.2 | % | |||||||||||||
| Service, retail, dining and entertainment | 108.6 | 80.3 | 35.2 | % | 531.6 | 351.8 | 51.1 | % | |||||||||||||
| Interest | 9.9 | 4.2 | 135.7 | % | 35.2 | 12.2 | 188.5 | % | |||||||||||||
| Brokerage commissions and other, net | 7.5 | 8.5 | (11.8) % | 34.9 | 30.2 | 15.6 | % | ||||||||||||||
| Total Revenues | 674.3 | 542.4 | 24.3 | % | 2,969.7 | 2,272.6 | 30.7 | % | |||||||||||||
| Expenses | |||||||||||||||||||||
| Property operating and maintenance | 155.4 | 125.6 | 23.7 | % | 624.6 | 500.8 | 24.7 | % | |||||||||||||
| Real estate tax | 27.4 | 24.4 | 12.3 | % | 110.6 | 94.8 | 16.7 | % | |||||||||||||
| Home costs and selling | 76.0 | 48.9 | 55.4 | % | 311.2 | 205.8 | 51.2 | % | |||||||||||||
| Service, retail, dining and entertainment | 109.4 | 80.3 | 36.2 | % | 472.7 | 307.9 | 53.5 | % | |||||||||||||
| General and administrative | 69.8 | 54.6 | 27.8 | % | 256.8 | 181.3 | 41.6 | % | |||||||||||||
| Catastrophic event-related charges, net | 5.2 | (0.9 | ) | N/M | 17.5 | 2.2 | N/M | ||||||||||||||
| Business combinations | 0.8 | 0.4 | 100.0 | % | 24.7 | 1.4 | N/M | ||||||||||||||
| Depreciation and amortization | 154.8 | 144.6 | 7.1 | % | 604.8 | 522.7 | 15.7 | % | |||||||||||||
| Loss on extinguishment of debt | — | — | N/A | 4.4 | 8.1 | (45.7) % | |||||||||||||||
| Interest | 67.6 | 42.4 | 59.4 | % | 229.8 | 158.6 | 44.9 | % | |||||||||||||
| Interest on mandatorily redeemable preferred OP units / equity | 1.1 | 1.1 | — | % | 4.2 | 4.2 | — | % | |||||||||||||
| Total Expenses | 667.5 | 521.4 | 28.0 | % | 2,661.3 | 1,987.8 | 33.9 | % | |||||||||||||
| Income Before Other Items | 6.8 | 21.0 | (67.6) % | 308.4 | 284.8 | 8.3 | % | ||||||||||||||
| Gain / (loss) on remeasurement of marketable securities | 20.6 | (9.7 | ) | N/M | (53.4 | ) | 33.5 | N/M | |||||||||||||
| Gain / (loss) on foreign currency exchanges | (16.3 | ) | 3.4 | N/M | 5.4 | (3.7 | ) | N/M | |||||||||||||
| Gain / (loss) on dispositions of properties | (0.3 | ) | — | N/A | 12.2 | 108.1 | (88.7) % | ||||||||||||||
| Other expense, net(6) | (4.7 | ) | (2.1 | ) | (123.8) % | (2.1 | ) | (12.1 | ) | (82.6) % | |||||||||||
| Gain / (loss) on remeasurement of notes receivable | (0.9 | ) | 0.1 | N/M | (0.8 | ) | 0.7 | N/M | |||||||||||||
| Income / (loss) from nonconsolidated affiliates | (0.9 | ) | 1.1 | N/M | 2.9 | 4.0 | (27.5) % | ||||||||||||||
| Loss on remeasurement of investment in nonconsolidated affiliates | (2.8 | ) | (0.1 | ) | N/M | (2.7 | ) | (0.2 | ) | N/M | |||||||||||
| Current tax benefit / (expense) | 2.2 | 0.2 | N/M | (10.3 | ) | (1.2 | ) | (758.3) % | |||||||||||||
| Deferred tax benefit / (expense) | 0.3 | 1.0 | (70.0) % | 4.2 | (0.1 | ) | N/M | ||||||||||||||
| Net Income | 4.0 | 14.9 | (73.2) % | 263.8 | 413.8 | (36.2) % | |||||||||||||||
| Less: Preferred return to preferred OP units / equity interests | 2.4 | 3.1 | (22.6) % | 11.0 | 12.1 | (9.1) % | |||||||||||||||
| Less: Income / (loss) attributable to noncontrolling interests | (3.1 | ) | (1.1 | ) | (181.8) % | 10.8 | 21.5 | (49.8) % | |||||||||||||
| Net Income Attributable to SUI Common Shareholders | $ | 4.7 | $ | 12.9 | (63.6) % | $ | 242.0 | $ | 380.2 | (36.3) % | |||||||||||
| Weighted average common shares outstanding – basic(7) | 123.1 | 115.2 | 6.9 | % | 120.2 | 112.6 | 6.7 | % | |||||||||||||
| Weighted average common shares outstanding – diluted(4)(7) | 125.8 | 115.7 | 8.7 | % | 122.9 | 115.1 | 6.8 | % | |||||||||||||
| Basic EPS | $ | 0.04 | $ | 0.11 | (63.6) % | $ | 2.00 | $ | 3.36 | (40.5) % | |||||||||||
| Diluted EPS(4) | $ | 0.04 | $ | 0.11 | (63.6) % | $ | 2.00 | $ | 3.36 | (40.5) % | |||||||||||
N/M = Percentage change is not meaningful.
N/A = Percentage change is not applicable.
Reconciliation of Net Income Attributable to SUI Common Shareholders to FFO(1)
(amounts in millions, except for per share data)
| Three Months Ended | Year Ended | ||||||||||||||
| December 31, 2022 | December 31, 2021 | December 31, 2022 | December 31, 2021 | ||||||||||||
| Net Income Attributable to SUI Common Shareholders | $ | 4.7 | $ | 12.9 | $ | 242.0 | $ | 380.2 | |||||||
| Adjustments | |||||||||||||||
| Depreciation and amortization | 154.0 | 144.5 | 602.6 | 521.9 | |||||||||||
| Depreciation on nonconsolidated affiliates | — | — | 0.1 | 0.1 | |||||||||||
| (Gain) / loss on remeasurement of marketable securities | (20.6 | ) | 9.7 | 53.4 | (33.5 | ) | |||||||||
| Loss on remeasurement of investment in nonconsolidated affiliates | 2.8 | 0.1 | 2.7 | 0.2 | |||||||||||
| (Gain) / loss on remeasurement of notes receivable | 0.9 | (0.1 | ) | 0.8 | (0.7 | ) | |||||||||
| (Gain) / loss on dispositions of properties | 0.3 | — | (12.2 | ) | (108.1 | ) | |||||||||
| Add: Returns on preferred OP units | 0.5 | 0.8 | 9.5 | 4.0 | |||||||||||
| Add: Income / (loss) attributable to noncontrolling interests | (2.5 | ) | (1.3 | ) | 10.4 | 14.7 | |||||||||
| Gain on dispositions of assets, net | (10.7 | ) | (14.2 | ) | (54.9 | ) | (60.5 | ) | |||||||
| FFO(1)(4) | $ | 129.4 | $ | 152.4 | $ | 854.4 | $ | 718.3 | |||||||
| Adjustments | |||||||||||||||
| Business combination expense and other acquisition related costs(8) | 7.3 | 3.3 | 47.4 | 10.0 | |||||||||||
| Loss on extinguishment of debt | — | — | 4.4 | 8.1 | |||||||||||
| Catastrophic event-related charges, net | 5.2 | (0.9 | ) | 17.5 | 2.2 | ||||||||||
| Loss of earnings – catastrophic event-related charges, net | 4.6 | (0.2 | ) | 4.8 | 0.2 | ||||||||||
| (Gain) / loss on foreign currency exchanges | 16.3 | (3.4 | ) | (5.4 | ) | 3.7 | |||||||||
| Other adjustments, net(9) | 5.5 | 4.7 | 0.4 | 16.2 | |||||||||||
| Core FFO(1)(4) | $ | 168.3 | $ | 155.9 | $ | 923.5 | $ | 758.7 | |||||||
| Foreign currency translation impact(a) | 1.7 | — | 11.0 | — | |||||||||||
| Constant Currency Core FFO(1)(4) | $ | 170.0 | $ | 155.9 | $ | 934.5 | $ | 758.7 | |||||||
| Weighted Average Common Shares Outstanding – Diluted(7) | 126.5 | 119.3 | 125.6 | 116.5 | |||||||||||
| FFO(1)(4) per Share | $ | 1.02 | $ | 1.28 | $ | 6.80 | $ | 6.16 | |||||||
| Core FFO(1)(4) per Share | $ | 1.33 | $ | 1.31 | $ | 7.35 | $ | 6.51 | |||||||
| Constant Currency Core FFO(1)(4) per Share | $ | 1.34 | $ | 1.31 | $ | 7.44 | $ | 6.51 | |||||||
(a) The Company calculated the foreign currency translation impact by comparing the actual weighted average foreign currency rates with the weighted average foreign currency rates used for guidance, as follows:
| Three Months Ended | Year Ended | ||||||||||
| December 31, 2022 | December 31, 2022 | ||||||||||
| Actual | Guidance | Actual | Guidance | ||||||||
| U.S. Dollars per Pounds Sterling | $ | 1.1452 | $ | 1.330 | $ | 1.2041 | $ | 1.330 | |||
| U.S. Dollars per Canadian Dollars | $ | 0.7380 | $ | 0.770 | $ | 0.7692 | $ | 0.770 | |||
| U.S. Dollars per Australian Dollars | $ | 0.6463 | $ | 0.756 | $ | 0.7282 | $ | 0.756 | |||
Reconciliation of Net Income Attributable to SUI Common Shareholders to NOI(1)
(amounts in millions)
| Three Months Ended | Year Ended | ||||||||||||||
| December 31, 2022 | December 31, 2021 | December 31, 2022 | December 31, 2021 | ||||||||||||
| Net Income Attributable to SUI Common Shareholders | $ | 4.7 | $ | 12.9 | $ | 242.0 | $ | 380.2 | |||||||
| Interest income | (9.9 | ) | (4.2 | ) | (35.2 | ) | (12.2 | ) | |||||||
| Brokerage commissions and other revenues, net | (7.5 | ) | (8.5 | ) | (34.9 | ) | (30.2 | ) | |||||||
| General and administrative | 69.8 | 54.6 | 256.8 | 181.3 | |||||||||||
| Catastrophic event-related charges, net | 5.2 | (0.9 | ) | 17.5 | 2.2 | ||||||||||
| Business combination expense | 0.8 | 0.4 | 24.7 | 1.4 | |||||||||||
| Depreciation and amortization | 154.8 | 144.6 | 604.8 | 522.7 | |||||||||||
| Loss on extinguishment of debt | — | — | 4.4 | 8.1 | |||||||||||
| Interest expense | 67.6 | 42.4 | 229.8 | 158.6 | |||||||||||
| Interest on mandatorily redeemable preferred OP units / equity | 1.1 | 1.1 | 4.2 | 4.2 | |||||||||||
| (Gain) / loss on remeasurement of marketable securities | (20.6 | ) | 9.7 | 53.4 | (33.5 | ) | |||||||||
| (Gain) / loss on foreign currency exchanges | 16.3 | (3.4 | ) | (5.4 | ) | 3.7 | |||||||||
| (Gain) / loss on disposition of property | 0.3 | — | (12.2 | ) | (108.1 | ) | |||||||||
| Other expense, net(6) | 4.7 | 2.1 | 2.1 | 12.1 | |||||||||||
| (Gain) / loss on remeasurement of notes receivable | 0.9 | (0.1 | ) | 0.8 | (0.7 | ) | |||||||||
| (Income) / loss from nonconsolidated affiliates | 0.9 | (1.1 | ) | (2.9 | ) | (4.0 | ) | ||||||||
| Loss on remeasurement of investment in nonconsolidated affiliates | 2.8 | 0.1 | 2.7 | 0.2 | |||||||||||
| Current tax expense / (benefit) | (2.2 | ) | (0.2 | ) | 10.3 | 1.2 | |||||||||
| Deferred tax expense / (benefit) | (0.3 | ) | (1.0 | ) | (4.2 | ) | 0.1 | ||||||||
| Preferred return to preferred OP units / equity interests | 2.4 | 3.1 | 11.0 | 12.1 | |||||||||||
| Add: Income / (loss) attributable to noncontrolling interests | (3.1 | ) | (1.1 | ) | 10.8 | 21.5 | |||||||||
| NOI(1) | $ | 288.7 | $ | 250.5 | $ | 1,380.5 | $ | 1,120.9 | |||||||
| Three Months Ended | Year Ended | |||||||||||
| December 31, 2022 | December 31, 2021 | December 31, 2022 | December 31, 2021 | |||||||||
| Real Property NOI(1) | $ | 257.8 | $ | 234.3 | $ | 1,167.0 | $ | 1,002.6 | ||||
| Home Sales NOI(1) | 31.7 | 16.2 | 154.6 | 74.4 | ||||||||
| Service, retail, dining and entertainment NOI(1) | (0.8 | ) | — | 58.9 | 43.9 | |||||||
| NOI(1) | $ | 288.7 | $ | 250.5 | $ | 1,380.5 | $ | 1,120.9 | ||||
Reconciliation of Net Income Attributable to SUI Common Shareholders to Recurring EBITDA(1)
(amounts in millions)
| Three Months Ended | Year Ended | ||||||||||||||
| December 31, 2022 | December 31, 2021 | December 31, 2022 | December 31, 2021 | ||||||||||||
| Net Income Attributable to SUI Common Shareholders | $ | 4.7 | $ | 12.9 | $ | 242.0 | $ | 380.2 | |||||||
| Adjustments | |||||||||||||||
| Depreciation and amortization | 154.8 | 144.6 | 604.8 | 522.7 | |||||||||||
| Loss on extinguishment of debt | — | — | 4.4 | 8.1 | |||||||||||
| Interest expense | 67.6 | 42.4 | 229.8 | 158.6 | |||||||||||
| Interest on mandatorily redeemable preferred OP units / equity | 1.1 | 1.1 | 4.2 | 4.2 | |||||||||||
| Current tax (benefit) / expense | (2.2 | ) | (0.2 | ) | 10.3 | 1.2 | |||||||||
| Deferred tax (benefit) / expense | (0.3 | ) | (1.0 | ) | (4.2 | ) | 0.1 | ||||||||
| (Income) / loss from nonconsolidated affiliates | 0.9 | (1.1 | ) | (2.9 | ) | (4.0 | ) | ||||||||
| Less: (Gain) / loss on dispositions of properties | 0.3 | — | (12.2 | ) | (108.1 | ) | |||||||||
| Less: Gain on dispositions of assets, net | (10.7 | ) | (14.2 | ) | (54.9 | ) | (60.5 | ) | |||||||
| EBITDAre(1) | $ | 216.2 | $ | 184.5 | $ | 1,021.3 | $ | 902.5 | |||||||
| Adjustments | |||||||||||||||
| Catastrophic event-related charges, net | 5.2 | (0.9 | ) | 17.5 | 2.2 | ||||||||||
| Business combination expense | 0.8 | 0.4 | 24.7 | 1.4 | |||||||||||
| (Gain) / loss on remeasurement of marketable securities | (20.6 | ) | 9.7 | 53.4 | (33.5 | ) | |||||||||
| (Gain) / loss on foreign currency transactions | 16.3 | (3.4 | ) | (5.4 | ) | 3.7 | |||||||||
| Other expense, net(6) | 4.7 | 2.1 | 2.1 | 12.1 | |||||||||||
| (Gain) / loss on remeasurement of notes receivable | 0.9 | (0.1 | ) | 0.8 | (0.7 | ) | |||||||||
| Loss on remeasurement of investment in nonconsolidated affiliates | 2.8 | 0.1 | 2.7 | 0.2 | |||||||||||
| Preferred return to preferred OP units / equity interests | 2.4 | 3.1 | 11.0 | 12.1 | |||||||||||
| Add: Income / (loss) attributable to noncontrolling interests | (3.1 | ) | (1.1 | ) | 10.8 | 21.5 | |||||||||
| Add: Gain on dispositions of assets, net | 10.7 | 14.2 | 54.9 | 60.5 | |||||||||||
| Recurring EBITDA(1) | $ | 236.3 | $ | 208.6 | $ | 1,193.8 | $ | 982.0 | |||||||
Same Property Summary(2) – MH / RV
(amounts in millions)
| Three Months Ended | ||||||||||||||||||||||||||
| Total Same Property – MH / RV | MH | RV | ||||||||||||||||||||||||
| December 31, 2022 | December 31, 2021 | % Change(a) | December 31, 2022 | December 31, 2021 | % Change(a) | December 31, 2022 | December 31, 2021 | % Change(a) | ||||||||||||||||||
| Financial Information | ||||||||||||||||||||||||||
| Revenue | ||||||||||||||||||||||||||
| Real property (excluding transient and other) | $ | 237.1 | $ | 221.7 | 7.0 | % | $ | 187.6 | $ | 178.5 | 5.1 | % | $ | 49.5 | $ | 43.1 | 14.7 | % | ||||||||
| Real property – transient | 35.9 | 37.8 | (5.1) % | 0.3 | 0.3 | 25.5 | % | 35.6 | 37.6 | (5.3) % | ||||||||||||||||
| Other | 7.9 | 8.3 | (5.6) % | 4.3 | 4.8 | (11.2) % | 3.6 | 3.6 | 1.9 | % | ||||||||||||||||
| Total Operating | 280.9 | 267.8 | 4.9 | % | 192.2 | 183.6 | 4.7 | % | 88.7 | 84.3 | 5.3 | % | ||||||||||||||
| Expense | ||||||||||||||||||||||||||
| Property Operating(10)(11) | 95.9 | 90.6 | 5.8 | % | 52.7 | 47.1 | 12.0 | % | 43.2 | 43.6 | (0.9) % | |||||||||||||||
| Real Property NOI(1) | $ | 185.0 | $ | 177.2 | 4.4 | % | $ | 139.5 | $ | 136.5 | 2.2 | % | $ | 45.5 | $ | 40.7 | 11.8 | % | ||||||||
(a) Percentages are calculated based on unrounded numbers.
| Year Ended | ||||||||||||||||||||||||||
| Total Same Property – MH / RV | MH | RV | ||||||||||||||||||||||||
| December 31, 2022 | December 31, 2021 | % Change(a) | December 31, 2022 | December 31, 2021 | % Change(a) | December 31, 2022 | December 31, 2021 | % Change(a) | ||||||||||||||||||
| Financial Information | ||||||||||||||||||||||||||
| Revenue | ||||||||||||||||||||||||||
| Real property (excluding transient and other) | $ | 929.3 | $ | 873.0 | 6.4 | % | $ | 739.9 | $ | 707.4 | 4.6 | % | $ | 189.4 | $ | 165.6 | 14.4 | % | ||||||||
| Real property – transient | 245.0 | 237.5 | 3.1 | % | 1.2 | 1.5 | (14.8) % | 243.8 | 236.1 | 3.3 | % | |||||||||||||||
| Other | 43.5 | 41.9 | 3.9 | % | 19.8 | 19.0 | 3.7 | % | 23.7 | 22.8 | 4.0 | % | ||||||||||||||
| Total Operating | 1,217.8 | 1,152.4 | 5.7 | % | 760.9 | 727.9 | 4.5 | % | 456.9 | 424.5 | 7.6 | % | ||||||||||||||
| Expense | ||||||||||||||||||||||||||
| Property Operating(10)(11) | 398.1 | 374.9 | 6.2 | % | 202.7 | 187.5 | 8.1 | % | 195.4 | 187.4 | 4.2 | % | ||||||||||||||
| Real Property NOI(1) | $ | 819.7 | $ | 777.5 | 5.4 | % | $ | 558.2 | $ | 540.4 | 3.3 | % | $ | 261.5 | $ | 237.1 | 10.3 | % | ||||||||
(a) Percentages are calculated based on unrounded numbers.
Same Property Summary(2) – MH / RV (Continued)
(amounts in millions)
| As of | ||||||||||||||
| December 31, 2022 | December 31, 2021 | Change | % Change | |||||||||||
| Other Information | ||||||||||||||
| Number of properties(a) | 421 | 421 | — | |||||||||||
| MH occupancy | 97.1 | % | ||||||||||||
| RV occupancy | 100.0 | % | ||||||||||||
| MH & RV blended occupancy(3) | 97.8 | % | ||||||||||||
| Adjusted MH occupancy(3) | 98.2 | % | ||||||||||||
| Adjusted RV occupancy(3) | 100.0 | % | ||||||||||||
| Adjusted MH & RV blended occupancy(3) | 98.6 | % | 96.8 | % | 1.8 | % | ||||||||
| Sites available for development | 7,092 | 7,670 | (578 | ) | ||||||||||
| Monthly base rent per site – MH | $ | 635 | $ | 607 | $ | 28 | 4.6%(13) | |||||||
| Monthly base rent per site – RV(12) | $ | 555 | $ | 516 | $ | 39 | 7.6%(13) | |||||||
| Monthly base rent per site – Total(12) | $ | 617 | $ | 587 | $ | 30 | 5.0%(13) | |||||||
| Monthly base rent per site – MH Rental Program | $ | 1,225 | $ | 1,117 | $ | 108 | 9.7 | % | ||||||
(a) Financial results from properties disposed of, and the three impaired communities in the Fort Myers, Florida area related to Hurricane Ian, during the year have been removed from Same Property reporting.
Same Property Summary – Marina
(amounts in millions)
| Three Months Ended | ||||||||
| December 31, 2022 | December 31, 2021 | % Change(a) | ||||||
| Revenue | ||||||||
| Real property (excluding transient and other) | $ | 54.0 | $ | 50.0 | 8.2 | % | ||
| Real property – transient | 2.9 | 2.7 | 5.1 | % | ||||
| Other | 2.8 | 2.5 | 11.2 | % | ||||
| Total Operating | 59.7 | 55.2 | 8.2 | % | ||||
| Expense | ||||||||
| Property Operating(10) | 20.6 | 19.8 | 4.2 | % | ||||
| Real Property NOI(1) | $ | 39.1 | $ | 35.4 | 10.4 | % | ||
(a) Percentages are calculated based on unrounded numbers.
| Year Ended | ||||||||
| December 31, 2022 | December 31, 2021 | % Change(a) | ||||||
| Revenue | ||||||||
| Real property (excluding transient and other) | $ | 221.4 | $ | 205.6 | 7.7 | % | ||
| Real property – transient | 12.4 | 13.0 | (5.1) % | |||||
| Other | 12.3 | 11.4 | 8.7 | % | ||||
| Total Operating | 246.1 | 230.0 | 7.0 | % | ||||
| Expense | ||||||||
| Property Operating(10) | 84.1 | 79.5 | 5.8 | % | ||||
| Real Property NOI(1) | $ | 162.0 | $ | 150.5 | 7.7 | % | ||
(a) Percentages are calculated based on unrounded numbers.
| As of | ||||||
| December 31, 2022 | December 31, 2021 | % Change | ||||
| Other Information | ||||||
| Number of properties | 101 | 101 | — | % | ||
| Wet slip and dry storage spaces | 35,546 | 35,744 | (0.6) % | |||
Acquisitions and Other Summary (excluding UK Operations)(14)
(amounts in millions, except for statistical data)
| Three Months Ended | Year Ended | |||||
| December 31, 2022 | December 31, 2022 | |||||
| Revenues | ||||||
| Real property (excluding transient and other) | $ | 35.3 | $ | 145.8 | ||
| Real property – transient | 7.2 | 57.4 | ||||
| Other | 3.4 | 23.2 | ||||
| Total Operating | 45.9 | 226.4 | ||||
| Expenses | ||||||
| Property Operating(10) | 22.6 | 92.1 | ||||
| Real Property NOI(1) | $ | 23.3 | $ | 134.3 | ||
| Other Information | December 31, 2022 | |||||
| Number of properties | 92 | |||||
| MH and RV Developed sites | 6,961 | |||||
| MH and RV Occupied sites | 5,559 | |||||
| MH and RV Occupancy % | 79.9 | % | ||||
| Transient sites | 7,689 | |||||
| Wet slips and dry storage spaces | 12,277 | |||||
UK Operations Summary
(amounts in millions, except for statistical data)
| Three Months Ended | YTD Since Acquisition December 31, 2022 |
||||||
| December 31, 2022 | |||||||
| Revenues | |||||||
| Real property (excluding transient and other) | $ | 21.9 | $ | 60.0 | |||
| Real property – transient | 3.8 | 38.5 | |||||
| Other | 0.2 | 1.2 | |||||
| Total Operating | 25.9 | 99.7 | |||||
| Expenses | |||||||
| Property Operating(10) | 15.5 | 48.7 | |||||
| Real Property NOI(1) | 10.4 | 51.0 | |||||
| Home sales | |||||||
| Revenue | 45.7 | 190.4 | |||||
| Cost of home sales | 26.7 | 102.4 | |||||
| Home selling expenses | 1.9 | 5.5 | |||||
| NOI(1) | 17.1 | 82.5 | |||||
| Retail, dining and entertainment | |||||||
| Revenue | 5.0 | 32.8 | |||||
| Expense | 9.2 | 38.0 | |||||
| Net Operating Loss | (4.2 | ) | (5.2 | ) | |||
| UK Operations NOI(1) | $ | 23.3 | $ | 128.3 | |||
| Adjustment | |||||||
| Foreign currency translation impact | 3.7 | 15.6 | |||||
| UK Operations NOI(1) – Constant Currency | $ | 27.0 | $ | 143.9 | |||
| Other information | |||||||
| Number of properties | 55 | ||||||
| Developed sites | 18,227 | ||||||
| Occupied sites | 16,223 | ||||||
| Occupancy % | 89.0 | % | |||||
| Transient sites | 3,143 | ||||||
| Sites available for development | 1,888 | ||||||
| Home Sales | |||||||
| New home sales volume | 212 | 1,158 | |||||
| Pre-owned home sales volume | 345 | 1,019 | |||||
| Total home sales volume</span. | 557 | 2,177 | |||||
Marina Segment Summary
(amounts in millions, except for statistical data)
| Three Months Ended | Year Ended | |||||||||||||||||
| December 31, 2022 | December 31, 2021 | % Change | December 31, 2022 | December 31, 2021 | % Change | |||||||||||||
| Financial Information | ||||||||||||||||||
| Revenues | ||||||||||||||||||
| Real property (excluding transient and other) | $ | 81.7 | $ | 70.1 | 16.5 | % | $ | 321.8 | $ | 251.0 | 28.2 | % | ||||||
| Real property – transient | 4.2 | 3.4 | 23.5 | % | 18.9 | 14.8 | 27.7 | % | ||||||||||
| Other | 4.5 | 2.6 | 73.1 | % | 23.8 | 12.4 | 91.9 | % | ||||||||||
| Total Operating | 90.4 | 76.1 | 18.8 | % | 364.5 | 278.2 | 31.0 | % | ||||||||||
| Expenses | ||||||||||||||||||
| Property Operating(10) | 32.1 | 26.3 | 22.1 | % | 121.4 | 95.6 | 27.0 | % | ||||||||||
| Real Property NOI(1) | 58.3 | 49.8 | 17.1 | % | 243.1 | 182.6 | 33.1 | % | ||||||||||
| Service, retail, dining and entertainment | ||||||||||||||||||
| Revenue | 91.4 | 68.8 | 32.8 | % | 402.3 | 270.8 | 48.6 | % | ||||||||||
| Expense | 84.8 | 65.0 | 30.5 | % | 356.9 | 241.1 | 48.0 | % | ||||||||||
| NOI(1) | 6.6 | 3.8 | 73.7 | % | 45.4 | 29.7 | 52.9 | % | ||||||||||
| Marina NOI(1) | $ | 64.9 | $ | 53.6 | 21.1 | % | $ | 288.5 | $ | 212.3 | 35.9 | % | ||||||
| Other information | ||||||||||||||||||
| Number of properties | 134 | 125 | 7.2 | % | ||||||||||||||
| Total wet slips and dry storage spaces | 47,823 | 45,155 | 5.9 | % | ||||||||||||||
Home Sales Summary (excluding UK home sales)
(amounts in millions, except for *)
| Three Months Ended | Year Ended | ||||||||||||||||||||||||||||||||||||||||||||||||||||||||||||||||||||||||||||||||||||||||||||||||||||||||||||||||||||||||||||||||||||||||||||||||||||||||||||||||||||||||||||||||||||||||||||||||||||||||||||||||||||||||||||||||||||||||||||||||||||||||||||||||||||||||||||||||||||||||||||||||||||||||||||||||||||||||||||||||||||||||||||||||||||||||||||||||||||||||||||||||||||||||||||||||||||||||||||||||||||||||||||||||||||||||||||||||||||||||||||||||||||||||||||||||||||||||||||||||||||||||||||||||||||||||||||||||||||||||||||||||||||||||||||||||||||||||||||||||||||||||||||||||||||||||||||||||||||||||||||||||||||||||||||||||||||||||||||||||||||||||||||||||||||||||||||||||||||||||||||||||||||||||||||||||||||||||||||||||||||||||||||||||||||||||||||||||||||||||||||||||||||||||||||||||||||||||||||||||||||||||||||||||||||||||||||||||||||||||||||||||||||||||||||||||||||||||||||||||||||||||||||||||||||||||||||||||||||||||||||||||||||||||||||||||||||||||||||||||||||||||||||||||||||||||||||||||||||||
| December 31, 2022 | December 31, 2021 | % Change | December 31, 2022 | December 31, 2021 | % Change | ||||||||||||||||||||||||||||||||||||||||||||||||||||||||||||||||||||||||||||||||||||||||||||||||||||||||||||||||||||||||||||||||||||||||||||||||||||||||||||||||||||||||||||||||||||||||||||||||||||||||||||||||||||||||||||||||||||||||||||||||||||||||||||||||||||||||||||||||||||||||||||||||||||||||||||||||||||||||||||||||||||||||||||||||||||||||||||||||||||||||||||||||||||||||||||||||||||||||||||||||||||||||||||||||||||||||||||||||||||||||||||||||||||||||||||||||||||||||||||||||||||||||||||||||||||||||||||||||||||||||||||||||||||||||||||||||||||||||||||||||||||||||||||||||||||||||||||||||||||||||||||||||||||||||||||||||||||||||||||||||||||||||||||||||||||||||||||||||||||||||||||||||||||||||||||||||||||||||||||||||||||||||||||||||||||||||||||||||||||||||||||||||||||||||||||||||||||||||||||||||||||||||||||||||||||||||||||||||||||||||||||||||||||||||||||||||||||||||||||||||||||||||||||||||||||||||||||||||||||||||||||||||||||||||||||||||||||||||||||||||||||||||||||||||||||||||||||||||||
| Financial Information | |||||||||||||||||||||||||||||||||||||||||||||||||||||||||||||||||||||||||||||||||||||||||||||||||||||||||||||||||||||||||||||||||||||||||||||||||||||||||||||||||||||||||||||||||||||||||||||||||||||||||||||||||||||||||||||||||||||||||||||||||||||||||||||||||||||||||||||||||||||||||||||||||||||||||||||||||||||||||||||||||||||||||||||||||||||||||||||||||||||||||||||||||||||||||||||||||||||||||||||||||||||||||||||||||||||||||||||||||||||||||||||||||||||||||||||||||||||||||||||||||||||||||||||||||||||||||||||||||||||||||||||||||||||||||||||||||||||||||||||||||||||||||||||||||||||||||||||||||||||||||||||||||||||||||||||||||||||||||||||||||||||||||||||||||||||||||||||||||||||||||||||||||||||||||||||||||||||||||||||||||||||||||||||||||||||||||||||||||||||||||||||||||||||||||||||||||||||||||||||||||||||||||||||||||||||||||||||||||||||||||||||||||||||||||||||||||||||||||||||||||||||||||||||||||||||||||||||||||||||||||||||||||||||||||||||||||||||||||||||||||||||||||||||||||||||||||||||||||||||||
| New Homes (amounts in millions, except for *)
Operating Statistics for MH and Annual RVs (excluding UK Operations)
Acquisitions and Dispositions
(a) Combined with an existing property. (b) Contains one development property. Capital Expenditures and Investments
The Company classifies its investments in properties into the following categories: Recurring Capital Expenditures – Property recurring capital expenditures are necessary to maintain asset quality, including purchasing and replacing assets used to operate the communities and marinas. Recurring capital expenditures at the Company’s MH and RV properties include items such as: major road, driveway, pool improvements; clubhouse renovations; adding or replacing streetlights; playground equipment; signage; maintenance facilities; manager housing and property vehicles. Recurring capital expenditures at its marinas include items such as: dredging, dock repairs and improvements, and equipment maintenance and upgrades. The minimum capitalized amount is five hundred dollars. Non-Recurring Capital Expenditures Lot Modifications – Lot modification capital expenditures are incurred to modify the foundational structures required to set a new home after a previous home has been removed. These expenditures are necessary to create a revenue stream from a new site renter and often improve the quality of the community. Other lot modification expenditures include land improvements added to annual RV sites to aid in the conversion of transient RV guests to annual contracts. Growth Projects – Growth projects consist of revenue generating or expense reducing activities at MH and RV communities, and marinas. This includes, but is not limited to, utility efficiency and renewable energy projects, site, slip or amenity upgrades such as the addition of a garage, shed or boat lift, and other special capital projects that substantiate an incremental rental increase. Rebranding – Rebranding includes new signage at the Company’s RV communities and costs of building an RV mobile application and updated website. Acquisitions – Capital expenditures related to acquisitions represent the purchase price of existing operating properties and land parcels to develop expansions or new properties. Expenditures consist of capital improvements identified during due diligence that are necessary to bring the properties to the Company’s operating standards. These costs for the year ended December 31, 2022, include $114.0 million at its MH and RV properties and $166.3 million at its marina properties. For the years ended December 31, 2021 and 2020, these costs were $75.8 million at its MH and RV properties and $100.7 million at its marina properties, and $40.6 million at its MH and RV properties, respectively. These include items such as: upgrading clubhouses; landscaping; new street light systems; new mail delivery systems; pool renovation including larger decks, heaters and furniture; new maintenance facilities; lot modifications; and new signage including main signs and internal road signs. These are considered acquisition costs and although identified during due diligence, often require 24 to 36 months after closing to complete. Expansions and Developments – Expansion and development expenditures consist primarily of construction costs such as roads, activities and amenities, and costs necessary to complete home and RV site improvements, such as driveways, sidewalks and landscaping at the Company’s MH and RV communities. Expenditures also include costs to rebuild after damage has been incurred at MH, RV or marina properties, and research and development. Recurring Capex per Site / Slip / Dry Storage Space – Average based on actual number of MH / RV sites and Marina wet slips and dry storage spaces associated with the recurring capital expenditures in each period. Outstanding Securities and Capitalization
^ Annual distribution is based on the last quarterly distribution annualized. (a) Calculation may yield minor differences due to fractional shares paid in cash to the shareholder at conversion.
Debt Analysis (amounts in millions, except for *)
(a) As of December 31, 2022, £400.0 million ($483.6 million) was swapped to fix the floating rate, resulting in an interest rate of 3.66%. (b) Percentages include the impact of hedge activity. (c) Weighted average interest rate includes the impact of derivative transactions. Endnotes, Reconciliations and Definitions (1) Investors in and analysts following the real estate industry utilize funds from operations (“FFO”), net operating income (“NOI”), and earnings before interest, tax, depreciation and amortization (“EBITDA”) as supplemental performance measures. The Company believes that FFO, NOI and EBITDA are appropriate measures given their wide use by and relevance to investors and analysts. Additionally, FFO, NOI and EBITDA are commonly used in various ratios, pricing multiples, yields and returns and valuation calculations used to measure financial position, performance and value.
FFO FFO is defined by the National Association of Real Estate Investment Trusts (“NAREIT”) as GAAP net income (loss), excluding gains (or losses) from sales of depreciable operating property, plus real estate related depreciation and amortization, real estate related impairments, and after adjustments for nonconsolidated partnerships and joint ventures. FFO is a non-GAAP financial measure that management believes is a useful supplemental measure of the Company’s operating performance. By excluding gains and losses related to sales of previously depreciated operating real estate assets, real estate related impairment and real estate asset depreciation and amortization (which can vary among owners of identical assets in similar condition based on historical cost accounting and useful life estimates), FFO provides a performance measure that, when compared period-over-period, reflects the impact to operations from trends in occupancy rates, rental rates and operating costs, providing perspective not readily apparent from GAAP net income (loss). Management believes the use of FFO has been beneficial in improving the understanding of operating results of REITs among the investing public and making comparisons of REIT operating results more meaningful. The Company also uses FFO excluding certain gain and loss items that management considers unrelated to the operational and financial performance of the Company’s core business (“Core FFO”). In addition, the Company calculates Constant Currency Core FFO by translating the operating results from the UK, Canada and Australia at the foreign currency exchange rates used for guidance. The Company believes that Core FFO and Constant Currency Core FFO provide enhanced comparability for investor evaluations of period-over-period results. The Company believes that GAAP net income (loss) is the most directly comparable measure to FFO. The principal limitation of FFO is that it does not replace GAAP net income (loss) as a financial performance measure or GAAP cash flow from operating activities as a measure of the Company’s liquidity. Because FFO excludes significant economic components of GAAP net income (loss) including depreciation and amortization, FFO should be used as a supplement to GAAP net income (loss) and not as an alternative to it. Furthermore, FFO is not intended as a measure of a REIT’s ability to meet debt principal repayments and other cash requirements, nor as a measure of working capital. FFO is calculated in accordance with the Company’s interpretation of standards established by Nareit, which may not be comparable to FFO reported by other REITs that interpret the Nareit definition differently. NOI NOI is derived from revenues minus property operating expenses and real estate taxes. NOI is a non-GAAP financial measure that the Company believes is helpful to investors as a supplemental measure of operating performance because it is an indicator of the return on property investment and provides a method of comparing property performance over time. The Company uses NOI as a key measure when evaluating performance and growth of particular properties and / or groups of properties. The principal limitation of NOI is that it excludes depreciation, amortization, interest expense and non-property specific expenses such as general and administrative expenses, all of which are significant costs. Therefore, NOI is a measure of the operating performance of the properties of the Company rather than of the Company overall. In addition, the Company calculates Constant Currency NOI for its UK Operations by translating the operating results from the UK at the foreign currency exchange rate used for guidance. The Company believes that NOI and Constant Currency NOI provide enhanced comparability for investor evaluation of properties performance and growth over time. The Company believes that GAAP net income (loss) is the most directly comparable measure to NOI. NOI should not be considered to be an alternative to GAAP net income (loss) as an indication of the Company’s financial performance or GAAP cash flow from operating activities as a measure of the Company’s liquidity; nor is it indicative of funds available for the Company’s cash needs, including its ability to make cash distributions. Because of the inclusion of items such as interest, depreciation and amortization, the use of GAAP net income (loss) as a performance measure is limited as these items may not accurately reflect the actual change in market value of a property, in the case of depreciation and in the case of interest, may not necessarily be linked to the operating performance of a real estate asset, as it is often incurred at a parent company level and not at a property level. In addition, the Company calculates Constant Currency NOI for its UK Operations by translating the operating results at the foreign currency exchange rate used for guidance. The Company believes that NOI and Constant Currency NOI provide enhanced comparability for investor evaluations of period-over-period results. Same Property NOI – A key management tool used when evaluating performance and growth of the Company’s properties is a comparison of the Same Property portfolio. The Company defines same properties as those the Company has owned and operated continuously since January 1, 2021. Same properties exclude ground-up development properties, acquired properties and properties sold after December 31, 2020. The Company believes that Same Property NOI is helpful to investors as a supplemental comparative performance measure of the income generated from the Same property portfolio from one period to the next. The Same Property data may change from time-to-time depending on acquisitions, dispositions, management discretion, significant transactions or unique situations. Same Property NOI does not include the revenues and expenses related to home sales, service, retail, dining and entertainment activities at the properties. EBITDA EBITDA as defined by Nareit (referred to as “EBITDAre“) is calculated as GAAP net income (loss), plus interest expense, plus income tax expense, plus depreciation and amortization, plus or minus losses or gains on the disposition of depreciated property (including losses or gains on change of control), plus impairment write-downs of depreciated property and of investments in nonconsolidated affiliates caused by a decrease in value of depreciated property in the affiliate, and adjustments to reflect the entity’s share of EBITDAre of nonconsolidated affiliates. EBITDAre is a non-GAAP financial measure that the Company uses to evaluate its ability to incur and service debt, fund dividends and other cash needs and cover fixed costs. Investors utilize EBITDAre as a supplemental measure to evaluate and compare investment quality and enterprise value of REITs. The Company also uses EBITDAre excluding certain gain and loss items that management considers unrelated to measurement of the Company’s performance on a basis that is independent of capital structure (“Recurring EBITDA”). The Company believes that GAAP net income (loss) is the most directly comparable measure to EBITDAre. EBITDAre is not intended to be used as a measure of the Company’s cash generated by operations or its dividend-paying capacity, and should therefore not replace GAAP net income (loss) as an indication of the Company’s financial performance or GAAP cash flow from operating, investing and financing activities as measures of liquidity. (2) Same Property results for the Company’s MH and RV properties reflect constant currency for comparative purposes. Canadian currency figures in the prior comparative period have been translated at the 2022 average exchange rate of $0.7366 USD per Canadian dollar. (3) The Same Property MH and RV blended occupancy for 2022 is derived from 123,349 developed sites, of which 120,614 were occupied. The Same Property adjusted MH and RV blended occupancy percentage is derived from 122,351 developed sites, of which 120,614 were occupied. The number of developed sites excludes RV transient sites and nearly 1,000 recently completed but vacant MH expansion sites. The Same Property adjusted MH and RV blended occupancy percentage for 2021 has been adjusted to reflect incremental period-over-period growth from newly occupied expansion sites and the conversion of transient RV sites to annual RV sites. (4) The effect of certain anti-dilutive convertible securities is excluded from these items. (5) Revenue producing site net gains do not include occupied sites acquired during the year. (6) Other expense, net was as follows (in millions):
(7) Calculations of Diluted weighted average common shares outstanding for EPS and FFO are as follows:
(8) Other acquisition related costs represent (a) nonrecurring integration expenses associated with acquisitions during the three months and year ended December 31, 2022 and 2021, (b) costs associated with potential acquisitions that will not close, (c) costs associated with the termination of the bridge loan commitment during the three months ended March 31, 2022 related to the acquisition of Park Holidays and (d) expenses incurred to bring recently acquired properties up to the Company’s operating standards, including items such as tree trimming and painting costs that do not meet the Company’s capitalization policy. (9) Other adjustments, net was as follows (in millions):
(10) Results for the Company’s Same Property MH / RV, Same Property marina, UK Operations and Acquisitions and Other, net certain utility revenue against the related utility expense in Property Operating expense as follows (in millions):
Marina segment results (page 14) – Summary of utility revenue netted against the related utility expense in Property Operating expense (in millions). These amounts are broken out and included within Same Property Marina and Acquisition and Other in the table above.
(11) Same Property supplies and repair expense for the Company’s MH and RV properties excludes $1.2 million and $2.8 million for the three months and year ended December 31, 2021, respectively, of expenses incurred for recently acquired properties to bring the properties up to the Company’s operating standards, including items such as tree trimming and painting costs that do not meet the Company’s capitalization policy. (12) Monthly base rent per site pertains to annual RV sites and excludes transient RV sites. (13) Calculated using actual results without rounding. (14) Acquisitions and Other (excluding UK Operations) is comprised of recent acquisitions, recently opened ground-up development projects in stabilization and properties undergoing redevelopment. (15) Line of credit and other debt includes borrowings under the Company’s $4.2 billion senior credit facility and a $19.8 million unsecured term loan. Outstanding balances as of December 31, 2022 were as follows (in millions):
Line of credit and other debt previously included borrowings under the Company’s $2.0 billion credit facility and, the debt under the Company’s $12.0 million MH floor plan facility, which was terminated in October 2021. Certain financial information has been revised to reflect reclassifications in prior periods to conform to current period presentation.
Part 1 BReuters Q4 2022 Sun Communities Inc Earnings Call (per yahoo.com Q4 2022 Sun Communities Inc Earnings Call February 24, 2023 In this article: ParticipantsFernando Castro-Caratini; Executive VP & CFO; Sun Communities, Inc. Gary A. Shiffman; CEO, President & Chairman; Sun Communities, Inc. John Bandini McLaren; EVP; Sun Communities, Inc. Anthony Franklin Powell; Research Analyst; Barclays Bank PLC, Research Division Bradley Barrett Heffern; Analyst; RBC Capital Markets, Research Division John P. Kim; Senior U.S. Real Estate Analyst; BMO Capital Markets Equity Research Joshua Dennerlein; VP; BofA Securities, Research Division Keegan Grant Carl; Research Analyst; Wolfe Research, LLC Michael Goldsmith; Associate Director and Associate Analyst; UBS Investment Bank, Research Division Robyn Luu Stephen Thomas Sakwa; Senior MD & Senior Equity Research Analyst; Evercore ISI Institutional Equities, Research Division Wesley Keith Golladay; Senior Research Analyst; Robert W. Baird & Co. Incorporated, Research Division PresentationOperator Good morning, ladies and gentlemen, and thank you for standing by. Welcome to the Sun Communities Fourth Quarter and Year-end 2022 Earnings Conference Call. At this time, management would like me to inform you that certain statements made during this call, which are not historical facts, may be deemed forward-looking statements within the meanings of the Private Securities Litigation Reform Act of 1995. Although the company believes the expectations reflected in any forward-looking statements are based on reasonable assumptions, the company can provide no assurance that these expectations will be achieved. Factors and risks that could cause actual results to differ materially from expectations are detailed in yesterday’s press release and from time to time in the company’s periodic filings with the SEC. The company undertakes no obligation to advise or update any forward-looking statements to reflect events or circumstances after the date of this release. Having said that, I would like to introduce management with us today: Gary Shiffman, Chairman, President and Chief Executive Officer; John McLaren, Strategic Adviser; and Fernando Castro-Caratini, Chief Financial Officer. After their remarks, there will be an opportunity to ask questions. (Operator Instructions) As a reminder, this call is being recorded. I’ll now turn the call over to Gary Shiffman, Chairman, President and Chief Executive Officer. Mr. Shiffman, you may begin. Gary A. Shiffman Good morning, and thank you for joining us as we discuss fourth quarter and full year results for 2022 and our guidance for 2023. This year marks Sun’s 30th year as a public company. And over the past 3 decades, we have established a track record of strategically expanding and diversifying our portfolio of recession-resistant, best-in-class properties. We and our stakeholders have benefited from the compelling supply and demand dynamics that underpin manufactured housing, RV communities and marinas. Our strategic approach has delivered an attractive balance of a reliable organic growth and strong FFO per share increases. We have increased rents throughout economic cycles, and our strong results for 2022 and outlook for Same Property NOI growth in 2023 demonstrates the benefits of operating in segments where supply is perpetually constrained and demand is resilient. In 2022, core FFO per share grew 12.9%, driven by strong demand for our offerings as well as our accretive investment activity. Demand for our manufactured housing communities and RV locations is evident in our consistently high occupancy levels, gains in revenue-producing sites and solid Same Property NOI growth. At year-end, our combined MH and RV occupancy was nearly 97%, reflecting approximately 96% occupancy within our manufactured housing portfolio. During the year, we achieved a record of over 2,900 revenue-producing site gains, driven by more than 2,250 conversions of transient RV sites to annual leases, which topped last year’s record conversions of nearly 1,700 sites and represented a 36% year-over-year increase. In marinas, our 2022 Same Property results continue to demonstrate supply-demand tailwinds, with a 12:1 ratio of registered boats in the U.S. to the existing supply of leasable wet slips and dry storage spaces. This creates a very sticky customer base and gives us the ability to grow rents. The resilience of our platform can be seen in our full year total manufactured housing, RV and marina Same Property NOI results, which grew by 5.8% over 2021. With regard to external growth, since acquiring Park Holidays in April 2022, we have focused on integration as well as being very selective in our approach to acquisitions. The U.K. market for holiday parks remains highly fragmented. And as we have done in the U.S. over the years, we have used our Park Holidays footprint to opportunistically scale our presence in the U.K. Subsequent to the Park Holidays transaction, we acquired 14 best-in-class holiday parks in the U.K. These investments have accretive going in cap rates, and we believe they will deliver significant ongoing growth and yield strong returns. In light of current market conditions, we have shown discipline with regard to our approach to capital allocation, and we’ll continue to do so going forward. As we sharpen our pencil and assess capital and funding alternatives, growing our revenue-producing sites through expansions and ground-up developments continues to offer accretive returns. During 2022, we delivered 2,000 new expansion and greenfield development sites in North America, which was at the high end of our guidance. These new sites will begin contributing revenue in 2023 and provide a new base for growth in the coming years. We have inventory of over 16,000 fully entitled sites for development and delivery in future years, representing embedded continued growth. Additionally, we regularly evaluate our portfolio for capital recycling opportunities to enhance our long-term growth profile. With respect to ESG, we continually identify ways that we can enhance our corporate citizenship. We recently set a target to achieve carbon neutrality by 2035 and net-zero emissions by 2045. And as previously announced, we added Jeff Blau, CEO of Related Companies, to our Board of Directors. Jeff’s experience and leadership will be a tremendous addition to our team. Lastly, our Board has raised our 2023 distribution to $3.72 per share, a 5.7% increase from the prior year. We’re very pleased with our 2022 achievements. I’d like to thank all of our Sun team members who contributed extraordinary efforts to our collective success. As we look ahead to 2023, we once again expect to deliver a year of solid Same Property growth. As our 30-year track record has demonstrated, we have a business model that delivers results throughout economic cycles, supported by compelling supply-demand fundamentals. We will remain disciplined in our investment activity, and our unparalleled expansion and development platform will continue to provide us with a differentiated growth opportunity. I will now turn the call over to John and Fernando to speak to our results and guidance in detail. John? John Bandini McLaren Thank you, Gary. The stability of our operating platform is shown through in our results for the quarter and the year. MH and RV Same Property NOI increased by 4.4% in the quarter. 4.9% growth in revenues reflected a 5% increase in weighted average monthly rent and a 180 basis point occupancy gain. 5.8% increase in expenses was primarily related to turnover costs in our rental program, as one consequence of the pandemic was lengthened average stay and therefore, higher related refurbishment costs. Having turned over these units, we are now able to realize higher rents on incoming leases. For the full year, Same Property MH and RV NOI grew 5.4%, driven by a 5.7% increase in revenue and a 6.2% increase in expenses. The strength of our portfolio is a direct result of our irreplaceable locations, the hard work of our team members and our continued reinvestment in our communities. At our RV communities, we set another annual record for site conversions to annual leases. Full year transient Same Property RV revenues grew by 3.1%, reflecting an average rate of growth of 14.1%, despite an almost 10% reduction in available site nights from the strategic conversion of transient sites to annual leases. Occupancy in our Same Property MH and RV portfolio remained strong, increasing 180 basis points during 2022 to end the year at 98.6%. Park Holidays’ portfolio is performing above our original underwriting, and the management team has done an excellent job integrating into Sun. The fourth quarter continued to show strength. For the 31 properties Park Holidays has owned since at least January 2021, home sales rose 17%. Full year weighted average rental rates increased 5.4%, driving a 24% increase in home revenues. Marina has exceeded our expectations with a 10.4% increase in same marina NOI during the quarter and a 7.7% increase for the full year. The outperformance is due to higher demand for wet slips and dry storage spaces. Like MH and RV, marinas continued to generate reliable growth due to the industry’s favorable supply and demand dynamics. In terms of external growth, during 2022 and through the date of this call, Sun acquired 70 operating properties for $2.2 billion and spent approximately $62 million for developable land parcels. The acquired land can support over 2,500 future MH and RV sites. Development is in Sun’s DNA. For the full year 2022, Sun delivered approximately 1,160 expansion sites at 11 existing communities and over 840 sites at 6 development communities in the U.S. for a total of 2,000 future revenue-producing sites. Looking ahead, we have a solid development and expansion pipeline that can deliver accretive growth for years to come as well as the proven skill set and platform to sustain our growth. Going forward, we will focus on delivering 2 to 3 new MH developments each year as well as continued expansions at our existing properties. With regard to home sales, our average new home selling price in the U.S. was $196,000 for the quarter, reflecting the high demand at and strategic locations at our properties. Within our MH and RV portfolio, we gained over 2,900 revenue-producing sites for the year. Total portfolio occupancy of 96.8% includes newly delivered development and expansion sites. Included in our revenue-producing site gains were over 2,250 transient RV annual lease conversions this year, a new record for Sun. We received an approximate 50% uplift in revenue in the first full year after conversion. Value proposition of an RV vacation 1 to 3 hours from home opens Sun to new customers who discover or rediscover the joy of a long-term RV experience. With regard to the 3 properties most directly affected by Hurricane Ian, I would note that the cleanup is complete, and we have started the rebuilding process. We relocated as many people as possible to other properties, including our team members in the area. We have recently received our first permit to place new homes, and our new home sales program is largely set in anticipation of reopening sites in the second half of the year. Finally, I want to express my gratitude to the entire Sun team for the privilege to serve as our President for the past 8 years and as Chief Operating Officer since 2008. We are an unparalleled team that has assembled a best-in-class portfolio and operating platform that has delivered impressive results over many years and continues to be positioned for future growth. As I assume my new responsibilities focusing on our MH development efforts, I look forward to supporting Bruce and the entire team. Fernando Castro-Caratini Thank you, John. For the year, Sun reported core FFO per diluted share of $7.35, a 12.9% increase from 2021. For the fourth quarter, we reported core FFO per diluted share of $1.33, a 1.5% increase from the prior year. Similar to last quarter, this quarter’s outperformance was driven by total marina real property NOI, interest income and U.K. tax favorability. As of December 31, Sun had $7.2 billion of debt outstanding that carried a weighted average interest rate of 3.8%, with a weighted average maturity of 7.4 years. On a run rate trailing 12-month basis, our net debt-to-EBITDA ratio was 5.8x. In terms of capital markets activity, during and subsequent to quarter end, we completed a $311 million add-on to an existing secured financing with a weighted average interest rate of 4.6%. The proceeds were used to repay amounts on our revolving credit facility. In January of this year, we issued $400 million of 10-year senior unsecured notes, which benefited from $250 million of treasury locks and used those proceeds to further reduce our line of credit balance. Since we achieved an investment-grade rating in 2021, we have now issued $2.2 billion of unsecured fixed-rate notes across 4 tranches. Pro forma for this activity, our floating-rate debt was reduced to 16% of total debt, which has now decreased from 26% as of December 31, 2020. Turning to guidance for 2023. As summarized in yesterday’s press release, we are establishing full year guidance for core FFO per share in the range of $7.22 to $7.42. We are also establishing guidance for first quarter 2023 core FFO per share in the range of $1.15 to $1.20. Note that we expect first quarter results to reflect the seasonality of U.K. operations, as outlined in our supplemental, which we acquired in April 2022. In 2023, we expect total Same Property NOI across manufactured housing, RV and marinas to increase between 4.9% and 5.9%. At the midpoint of the ranges summarized in our press release, this total Same Property NOI growth assumes 4.6% growth from manufactured housing, 5.8% growth from RV and a 7% increase from marinas. Regarding average rental rate increases, we reiterate the guidance ranges provided back in October. At the midpoint, these rental increases are 6.3% for manufactured housing, 7.8% for RV and 7.5% for marinas. On a total portfolio basis, we expect total revenues from real property to increase between 8.1% and 8.7% in 2023 and expenses to increase between 13.5% and 13.9%. Included in this expected expense growth is an approximately $18 million increase in property-related insurance costs. We expect total real property NOI to increase between 4.5% and 5.7% during 2023 due to strong resident, guest and member demand at our properties. Our U.K. operations are included in our guidance for total NOI. We are also providing certain guidance data points to help the investment community track Park Holidays’ performance. Our guidance assumes we increase revenue-producing sites by 2,800 to 3,100 sites in 2023. And we expect about 60% of these revenue-producing sites to come from RV transient site conversions to annual leases. We anticipate investing roughly $200 million in our ground-up development and expansion activity. Throughout 2022, we continue to focus on corporate expense rationalization, including process efficiencies and reducing our office footprint. Despite the high inflation environment, for 2023, we expect G&A expense to run between $256 million and $262 million, which equates to minimal growth over 2022 at the midpoint. Importantly, we expect our G&A as a percentage of revenue to decline this year. The final note, increasing interest rates were a headwind on FFO growth in the back half of 2022 and continue to be a headwind in our 2023 guidance. We actively managed our interest rate risk by paying down over $700 million of variable-rate debt in the past 3 months alone, with long-term fixed-rate debt, thereby continuing to reduce our floating rate exposure. We believe our guidance reflects the current interest rate outlook at the time of this call and is informed by forward interest rate curves as of the time of providing our guidance. Our platform of recession-resistant, best-in-class properties is positioned to continue generating strong cash flow growth for the benefit of our stakeholders. As a reminder, our guidance includes acquisitions, dispositions and capital markets activity through February 22, 2023, and the effect of a property disposition under contract expected to close in March 2023. It does not include the impact of prospective acquisitions, dispositions or capital markets activities, which may be included in research analyst estimates. This concludes our prepared remarks. We will now open the call for questions. Operator? Question and Answer SessionOperator (Operator Instructions) Our first question is from the line of Michael Goldsmith with UBS. Michael Goldsmith My first question is on the insurance. You called out $18 million increase in property-related insurance. When was your — when did your insurance renewal take place? How much is the insurance as a percentage of operating percentage? And just to try to frame it out, like if insurance is 15% to 20% of expenses and it was 20% higher than anticipated, that would be a 300 to 400 basis point headwind. So ex that drag, is the expense growth 6% to 7% and matching kind of like the top line growth? Fernando Castro-Caratini Michael, our insurance renewal occurred between November and January, November of last year and January of this year. Legal taxes and insurance of our Same Property portfolio represent — are expected to represent about 10% this year. That is an increase of about 300 basis points over 2022. So your math as far as the headwind from an expense growth perspective tracks. Michael Goldsmith Got it. And then my second question is just on the flow-through of the NOI growth. Your NOI is expected to grow 4.5% to 5.7%. Your Same Property NOI is growing 4.9% to 5.9%, yet your guidance is calling for earnings to be down in 2023. So can you walk through some of the pressure or other factors that are below the line that’s not when you see the Same Property NOI growth flow through to the FFO? Fernando Castro-Caratini Sure. The primary factor, as mentioned on the call, is going to be our interest expense for — projected interest expense for 2023. We are actively and programmatically working on a number of strategies to continue to reduce our exposure to variable-rate debt. But certainly, as we look out at expectations from a market perspective, there’s potential for 2023 to set baseline as far as interest expense and then that either becomes neutral or a tailwind heading into future years. Operator Our next question is from the line of Josh Dennerlein with Bank of America. Joshua Dennerlein I feel like throughout the fall, the messaging on the rate growth you were sending out was going to line up with expense growth. And correct me if I’m wrong, on — that’s kind of the message I got. Fernando Castro-Caratini In our conversations over the course of the fall, certainly, expectations for the rest of our expense line items to fall in line with that at the time and mentioned during our NAREIT meetings with investors, we had yet to fully set our insurance program for the year. So that was the remaining item from that perspective, and we did realize a larger-than-expected increase for 2023. Joshua Dennerlein Okay. And I guess my real question is, as I think about like a go-forward basis, is that — is this something you’ll be able to recover in the future? Like, obviously, like insurance jumped up a lot this year outside of your control a little bit. Like is there a way to kind of recover it kind of over the long term? Is that how you guys are thinking about it? Or has something kind of shifted in the model a bit? Gary A. Shiffman Josh, it’s Gary. We feel it’s definitely recoverable. One of the key factors of our business that we are able to pass on, expenses in the form of rental increases. And as we’ve talked about before, our business is really about reliable growth because of the strong demand and short supply. So our expectation is that we can’t [MHProNews note: the audio sounds like this word is “can” rather than “can’t”] pass-through the expenses. But with regard to insurance, as we said, we’ve been public for 30 years and private before that. I would suggest that we’re really seeing, maybe a little bit earlier than others from a renewal standpoint, what everybody else has been or will be seeing going forward. It reflects the environment for insurance at this point in time. As we know, that can go up and down. So our expectation is that we will pass-through these costs through rental increases as we go forward because they’re part of our operating business. But that being said, we can’t underscore the fact that with this increased cost, as Fernando mentioned of $18 million, we’re still seeing at Same Property growth of 5.4% at the midpoint. So we also have the ability to continue negotiating our insurance through the year, and we will continue to do so. But in the effort of being totally transparent of where our costs have gone to, that’s what is included in our guidance. Joshua Dennerlein Appreciate the color, Gary. One last one from me. I know the marinas at Safe Harbor. You guys are — there’s a membership program where now you can get your annual cost right in the asset at cost. Is that the main reason the service retail dining and entertainment NOI is declining year-over-year? And then how are you guys thinking about the kind of payback as you kind of increase rate on the annual side? Like is it a 2-year kind of payback, 3-year? How are you guys thinking about that? Gary A. Shiffman I don’t have the numbers right in front of me, and we can get back to you or perhaps Fernando does, but you’re absolutely correct. As everyone might recall, strategically, we are always looking to convert lower-margin business over to the stickier side of rent. And while these aren’t loss leaders, we are passing off gas, fuel at our cost to attract members. And I think it’s reflected by the fact that we now have a waiting list in 80% of our marinas. I think it’s growing from there right now, that we’ve noticed rental increases. What were they on the marina side, Fernando? Fernando Castro-Caratini At the midpoint, we were expecting 7.5% for this year. The wait-list, we’re now — we now have a wait-list at 91% of our marinas. And then Josh, yes, the bulk of the SRD&E NOI year-over-year is coming from that active program on the fuel side. And that SRD&E is really there and the service, as Gary mentioned, right, of having a member with us for an 8-plus-year period, and we’ll continue working through those strategies. Gary A. Shiffman So strategically, over time, we expect to more than capture that difference, certainly, on a multiple basis for the stickiness of the rental revenue versus the lower-margin business. That being said, we firmly feel that these SRD&E activities, especially the service, is very, very important to the occupancy and to the stickiness and demand for the Safe Harbor Marinas as compared to marinas that don’t offer the service. Operator Our next question is from the line of Steve Sakwa with Evercore ISI. Stephen Thomas Sakwa I guess maybe for Gary, just on the home sales in general, whether it’s U.S., U.K., are you seeing anything by region, by product type, by price point? Just curious how kind of the, I guess, economic uncertainties are kind of weighing on sales and whether you’re seeing any bumps in the road as you kind of look into ’23. Gary A. Shiffman Steve, I can share with you, as of this point, and I’ll let John go more into specific sales. New home sales are up. Average price was about… John Bandini McLaren $196,000. Gary A. Shiffman $196,000. I think it’s one of the high points that we’ve seen. I think it totally reflects quality, location and value of the assets in our portfolio. I think it clearly reflects a capital reinvestment that we’ve shared with our stakeholders before, that if we don’t reinvest in our communities, we do strip the equity right out from underneath the homeowners. So we have a stringent policy there. On the used — preowned home side of things, ironically, we’ve seen demand that’s so strong that we’ve been able to buy less inventory over a period of the last 12 months or so. So our new home or preowned home sales being down a little bit, it’s just reflective of the demand, people staying in their homes longer and the fact that they’re direct selling their homes. So there’s no interruption in rent to us, but we’re not able to buy the inventory to flip into the used homes as we have been. It tracks over a 30-year period of time that will go up and down a little bit, so we don’t see that as anything negative whatsoever. On the U.K. side, we’re seeing enormous strength on the higher end of home buying, the more expensive homes increasing. And I turn to John, who’s overseeing that, to talk a little bit more about the particulars of the U.K. home sales. John Bandini McLaren Yes. I mean with respect to U.K. home sales, I mean, our team over there sold over 2,900 houses in 2022, which is a 23% increase year-over-year. So like Gary said, the demand continues to be very strong, so much so that we — I think we shared before that we’ve built out almost 700 expansion sites over the course finishing in 2022, that all sold up in 2022 and look to expand another 500 going into the season this year, which will be filled up by the end of 2023. So really, really strong demand. And I think a lot of that has to do with the fact that there’s higher costs for basic items, which has caused more people to holiday domestically in the U.K. rather than go to Europe. We’re fortunate that the higher income earners in the U.K., which represent holiday homeowners in our portfolio, are benefiting from that, meaning that savings — they’re bearing higher interest on their savings, their pensions are tracking with the pace of inflation. And as we shared with the original information we provided on the deal, Brexit still makes it difficult to travel in the continent. It’s gotten more expensive. The pound is still devalued in comparison to this time last year, and it’s — most people travel within 2 hours to get to the properties. And so — and then the other thing that I would add is looking out into 2023 from a strength perspective, 90% of our owners have already paid their 2023 pitch fees in full are committed on direct debit. So things are rock-solid. Gary A. Shiffman That 90% is ahead of the same time last year and the previous years. Stephen Thomas Sakwa Great. I guess just one for Fernando on the balance sheet. Obviously, floating-rate debts caught a lot of people maybe not by surprise, but certainly been more powerful and had a bigger negative impact. I guess in hindsight, have you thought about the balance sheet and the way it wants to get constructed and maybe how you think about it philosophically on a go-forward basis in terms of fixed versus floating? Fernando Castro-Caratini Steve, I think we’ve been pretty programmatic since achieving our investment-grade rating in the summer of 2021. We’ve done over $2.2 billion of IG unsecured bonds with that public market. We’ve also taken advantage of the fact that our assets that are still under secured financing or still have mortgages, because of their strong performance, we’re able to borrow up on existing financings and did a $311 million one that closed between December and January over the course of the last couple of months. Today, we stand at about 16% floating-rate debt. As we look at our — as we look strategically at the portfolio, and Gary mentioned in his remarks, right, we can — we look at our investment program and ground-up development and expansion. We will be able to practically self-fund our investment activity in 2023, are selectively looking at opportunities on the capital recycling front. That’s a couple of assets here and there that over time can also reduce variable-rate debt. And I would remind the market, we have very manageable maturities, no looming towers over the course of the next couple of years. We have about $117 million, $118 million coming due in the second half of the year and are being programmatic about locking in that cost today, as we’ve done over the course of the last couple of years. But certainly looking to actively manage our exposure to floating-rate debt. Operator Our next question is from the line of John Kim with BMO Capital Markets. John P. Kim I wanted to follow Steve’s question. And he alluded to it, the rising rates is not necessarily a surprise, especially in the last few months. So I’m guessing, can you just walk us through why you allowed floating-rate debt to increase during the fourth quarter and refinance it post quarter? Fernando Castro-Caratini John, these financings as far as on the secured side take up some time to work through. It’s actually one that we started on in July of the second quarter. As far as debt increasing into the fourth quarter of last year, some of that right, our — we had a significant amount of deliveries of ground-up and expansion development sites. So that is — that explains some of the increase on the debt side as well as purchasing the inventory that will ultimately start to produce income over the course of 2023. Those would be the primary reasons from that perspective. And then about 20%, 25% of it is, right, we — is the FX on the debt amount. So from the end of September to the end of December, the pound did appreciate significantly. So that would — that accounts for about an additional $90 million of that quarter-to-quarter increase. John P. Kim And then to further reduce the floating rate exposure, are you looking to use interest rate swaps or utilize fixed-rate debt? Fernando Castro-Caratini We’ve been quite programmatic from that perspective to support our issuance in the unsecured bond market. We did over since December of 2021 about 850 of treasury locks and swaps. We also did swap GBP 400 million of our pound sterling term loan in the U.K. So yes, that does factor into our toolbox. John P. Kim Okay. A follow-up question on insurance. How much is your increase in insurance due to your exposure to Florida? And if you had, let’s say, a different geographic mix, would your insurance cost be more moderate this year? Gary A. Shiffman Yes. It’s a great question. And the scale and size, John, I think we’re able to get best-in-class pricing, so to speak, and it is a question that we certainly asked. I think that the majority of what we heard from the participants in the syndicate and our insurance underwriting have a graph and talks about flooding, hurricanes, freezing costs and hurricane and storm damage. And they look at the claims that they’ve paid out versus the premiums they’ve taken in. And I think this is where when I referred to the fact we’re seeing the reality of what’s out there overall. We’re not going to reflect that different than our competitors and other asset classes. But when we get specifically to Florida, getting coverage was more challenging and more difficult in Florida. We don’t have it broken down individually to Florida. We negotiate as a package. So I would just point to the overall increase in insurance. The fact that we’re in Florida, Texas and California is by design. There’s over 100 million people there, and we focus our geographic footprint and target the right markets to operate in. And the demand for affordable housing has never been stronger in those markets, so it speaks to the high occupancies, the ability to push through inflationary rental increases. And we will closely evaluate and continue to evaluate our exposure that is impacted by insurance as we go forward. John Bandini McLaren And I would just emphasize the point that Gary made in his answer, which is that this has a lot more to do with what events are taking place across the world, okay? This is less of a Sun issue, an asset class issue or anything like that. I mean you look at everything, whether it’s earthquakes in Turkey and so forth that’s impacting the cost of insurance for everybody. And really, that’s — I think that sort of everybody is, for lack of better words, the beneficiary of those events happening in the form of higher costs. John P. Kim I’m just wondering if that changes your view at all on where you allocate capital going forward, whether it’s U.K., Midwest or some other markets where it may alleviate some of these factors. Gary A. Shiffman I think that absolutely does have bearing on how we think about things and how we look at things. And you bring it up, and we happen to be talking about it not that long ago. But the fact of the matter is there’s 22 million people in Florida. 320,000, I think, we talked about moved in there last year. So strategically, we do have to think about the cost return proposition in that state as we do everywhere. And I would suggest that strategically, we’re looking at it very carefully. Operator Our next question is from the line of Keegan Carl with Wolfe Research. Keegan Grant Carl Maybe first on same store revenue expectations for ’23. They definitely came in looking pretty strong, so just a few questions. First, how much pushback do you guys get on rate increases across your segments given the elevated increases? And second, specifically on marinas, how much longer do you think you can push at an elevated level? I think the past channel checks we’ve done, there’s concern for a while that outsized pricing power is eventually going to deteriorate because it’s going to break boat owners. So curious for your thoughts there. Gary A. Shiffman I’ll address the marine part, and you can talk about the rest of the portfolio, John. But I think when we talk about supply/demand, we talk about over 11 million vessels registered for 800,000, 900,000 wet and dry slips. And as we spoke earlier, we’re intentionally shifting a value proposition that will support continued rental increases by offering memberships, the other lower-margin attributes such as fuel, such as discounted transient stays when there’s open sites or slips available and other membership opportunities. So with that kind of a supply/demand out of balance, we’re very comfortable and expecting to continue growth similar to what we’ve been experiencing. So we don’t currently see those type of headwinds that you’re suggesting in the marina business. And I’ll let John talk really about a 40-year history of manufactured housing. John Bandini McLaren Yes. I mean it’s — Keegan, it’s really it’s a balanced conversation, which is to say, obviously, looking at what expense growth is and applying to passing that on to our residents, but we view rent increases like a marathon versus a sprint. As we’ve shared before, I think folks have heard me say it 100 times is that the most expensive site we have in our portfolio is a vacant one. And I think our strategy has really stood the test of time. For 25-plus years, we’ve delivered positive revenue and NOI growth every year when others have seen ups and downs. We continue to deliver long-term cash flow stability. We maintain a solid relationship with our resident base, which is also our sales force. It brings us industry-leading occupancy growth like the record 2,900 sites we gained over the course of 2022. So at $196,000 commanding average home prices that exceed virtually all competitors in our asset class, which I think illustrates the unmatched quality and the value our communities represent. So really, in summary, our strategy is well balanced, we believe, across all stakeholders, including our residents that live in well-maintained communities and create value in their homes. And so it’s something that we watch and talk about very closely as we think about what increases and how we can push further on both MH and RV. Gary A. Shiffman And the only thing I’d add and then we covered in our posted deck is the delta difference between alternatives, whether it being single-family residential, whether it be multifamily, where you still do provide 25% more space at 50% of the per square foot cost offer a lot of advantages of being able to pull right up to the house, bring your groceries on, have your car in a carport, a garage, et cetera. And then while we certainly know there are headwinds on site buil[t] housing, especially due to mortgage rates, the delta difference between a single-family residence and the overall cost of living in one of our manufactured housing communities is such that for many, many Americans, manufactured housing will be the only option available for home ownership. So I think, again, 40-year track record, 30 public, 10 private, indicates that we will be able to continue to get the correct growth based on the value proposition. Same is true in the RV for vacationing. And certainly, in the U.K. as the second vacation home, an alternative to more expensive vacationing in the U.K. Keegan Grant Carl Got it. And then taking a step back, so if we think about your — both your real property, excluding transient and transient on a like-for-like basis, if we exclude your transient conversion expectations for ’23, where would the numbers shake out, both on excluding transient, then transient as a whole, right? Because you obviously expect to compare a lot of sites, which means the comparative pool for transient is going to be much lower. Fernando Castro-Caratini Keegan, I’ll give you the comparative for Same Property. We were expecting about a 90 basis point increase year-over-year in revenue from transient RV. That is on a base of approximately 7.5% to 8% fewer site nights. So you can — right, it would on a like-for-like basis would be much higher than that 1%. But as John mentioned or maybe I mentioned during — in my section of the script, we are expecting another very strong year of conversions from transient sites to annual leases. Of the 3,100 at the high end, 60% is expected on the RV side. And this is right, once you’ve converted that site, you have a resident there for on average a 5-or-plus year period of time. That is very likely making improvements to that site and bringing up the value of the community itself or being hyper-focused on continuing the conversion program over to the annual side. Keegan Grant Carl And just on the excluding transient portion too, right, what would the range be if you exclude your expectations because there’s going to be a bit of an uplift? Fernando Castro-Caratini I don’t have that broken out here in front of me. We can follow up, that’s a very quick follow-up with you after the call. Operator Our next question is from the line of Wes Golladay with Baird. Wesley Keith Golladay I just have a question on the service retail and dining guide. I just want to make sure I’m looking at it correctly. It does look like it’s going down a little bit year-over-year. And more so a question on how we should think about modeling this line item going forward. I think you mentioned and maybe in the prepared comments that it was almost like a loss leader. So should this only grow with acquisitions? And then second part, I did see a termination income. Is there anything impacting the guide this year from the termination of a lease? Gary A. Shiffman Yes, Wes, it’s Gary. I don’t want anyone to think of it as a loss leader because it’s not a loss leader. We’ve just elected to shift smaller margin over to higher valuation in the form of sticky rent. So we’re not losing money or subsidizing anything. And when we talk about passing on guests at our cost, it’s not just the cost we buy it at the pumper truck, but it’s the cost associated with delivering it. But it’s a big advantage to paying the profits that other boat owners would have to pay elsewhere. Fernando Castro-Caratini And on the lease termination, we did mention in my remarks, we did rationalize some space in our main office and got out of 2 floors in our offices here in Southfield. Wesley Keith Golladay Okay. Got it. And then you did mention potentially asset recycling. Do you have a preference from proceeds, whether it’s to pay down variable-rate debt or to recycle or to buy assets? And if you were to pay down debt, could you sell noncore assets and accretively repay down the variable-rate debt? Gary A. Shiffman I think everything is under review. We continue to evaluate parts of our portfolio where we think we can redeploy the capital with greater growth. Certainly with the headwinds of interest rates today, that is one big focus, Wes. So we’re not running to shed assets, but we are reviewing them very, very carefully as to growth. And as we’ve shared, again, that today, one of the areas that I think differentiates Sun and gives us the greatest opportunity is the ability to create new ground-up developments and expand our manufactured housing portfolio. So because there is a cost associated with over 16,000 sites that we’ve already bought and paid for, that are not yielding any return, we carry on debt. And by paying down that debt, if that’s what we elect to do, we obviously recapture of that lost interest rate. So that is one area. The second area is certainly funding the development costs so that we can generate the high returns and create value for the stakeholders by increasing our manufactured housing portfolio. And third, of course, is that difficult economies often turn up opportunities, and we are looking at a number of opportunities from all of the different platforms. There is nothing identified yet or nothing that is meaningful. But I believe in these periods of times, as I said before, as people have to refinance things at a whole new rate in a whole new world, opportunities may become available there that are accretive across our current cost of capital. So paying down variable debt is probably something that allows us greater opportunity to create growth in the future or if there’s something very accretive, we would look at that as well. So there’s no specific plan. I think just general good stewardship of how we think about reducing that variable debt. Operator Our next question is from the line of Robyn Luu with Green Street. Robyn Luu I wanted to follow up on the previous question on home sale trends in the U.S. and U.K. So home sale prices fell by 15% from last quarter in the U.K. but was flat in U.S. MH business. So I understand the fourth quarter is typically a seasonally slow period in the U.K., but can you maybe talk to the weakness in the U.K. prices? Is — does the 15% reflect market prices? Or are you perhaps pushing discounts to get the volume? John Bandini McLaren No. I mean it’s not really discounts to push the volume, but I think when we walked in, I think part of the investment thesis that we shared in the beginning was the fact that we might [thin the margin] a little bit to gain more sites and gain more ongoing revenue, okay, on those sites. And so basically, we’re just executing the plan that we set out to do. Gary A. Shiffman Yes. We prefer the stickiness of the rent over the onetime margin on the home sales. So you will continue to see an emphasis on that strategy as we go forward. Robyn Luu So that doesn’t reflect market prices to 15%. Gary A. Shiffman Sorry, Robyn, what was the question? Robyn Luu So the 15%, just to clarify, the 15% does not reflect market prices for U.K. home sales? Gary A. Shiffman No. I think it reflects our strategic plan with management. But it is interesting, as John pointed out, we’ve seen some higher growth on the higher end of what they refer to as the lodges. And that’s an area that we’re focusing on, and there are also smaller margins on the lodges than there are on the lower-based homes. Robyn Luu Yes. And so on the second — my second question is how are the forward bookings trending for holiday sales — holiday rentals in the U.K.? John Bandini McLaren They’re actually trending a little bit ahead of this past year, which of course, as we shared before, is great because that is the feeder for more holiday home sales and more rent paying sites. Gary A. Shiffman So in the Park Holidays portfolio, correct. [Maybe I’m thinking] this wrong, 40% of all homebuyers have stayed in one of the rentals in the property and 60% of all buyers have stayed in a rental, in a park, in a holiday property. So it really is the feeder, if you will. So seeing the demand, where it is now, is very encouraging for us. I will add that we did speak to them the other day. There is a fair amount of competition out there and some discounting that’s taking place outside of the Park Holidays and the more inferior properties, but I think it’s driving people to expect quality at Park Holidays. And with the addition of Park Leisure, which are really the high end of holiday vacation parks, they have a much lower percent of fleet home ownership in those 14 properties. John Bandini McLaren Almost none. Gary A. Shiffman Almost none, yes. We are seeing positive strength there. Operator Our next question is from the line of Brad Heffern with RBC Capital Markets. Bradley Barrett Heffern What are you seeing on the leading-edge demand for transient RV? I know it’s obviously the low demand time of year, but any color on what happened year-to-date in the forward bookings would be great. John Bandini McLaren Sure. I think from the booking pace perspective, right now, we are trending just a little bit ahead of last year, which is great. We are nearly 95% booked, which is better than we were at this time last year for Q1. So we’re running a little bit ahead. But if you look out into the whole year, we’re a little bit ahead. And total booking pace meaning bookings that have actually happened at this point in time versus where we were last year. Gary A. Shiffman I think I’d remind everybody, we’re going back to more of a pre-COVID normal pattern. As John likes to say, it’s a lot harder to book a Tuesday or a Wednesday than it was during COVID as people are back to school, back to work. And so our expectation is a more normalized year-over-year transient growth. People are still positive about experiencing that outdoor vacation. There is an increase in the surveys that we’ve done and our competitor has done, with expectation of RV stay and camping this coming year. So it’s more back to normal, I think. And a big focus that has really been there for almost 10 years now of the conversions that we talk a lot about, it is easier to forecast when we convert a transient to an annual. It is more cost effective in picking up that 50% increase on a per site basis for the first year, and about 7.5% conversions last year of our transient to annual. And going forward, we expect good solid growth this coming year. So we’re going to start to see a reduction of transient, which we’ll have to rethink about maybe 3 to 5 years from now as we’re thinking out of how we have an inventory of transient to convert to annual, and that will be a nice problem to solve. Bradley Barrett Heffern Okay. And then on the U.K., it looked like MH occupancy was down almost 300 basis points in the fourth quarter. Is that a demand impact? Is that seasonal? Or is there some other explanation? John Bandini McLaren That’s a result of adding sites to the portfolio through expansion. Operator Our next question is from the line of Anthony Powell with Barclays. Anthony Franklin Powell One quick one from me on acquisitions. Could you maybe go into the 3 deals you did in December, MH RV, marina in terms of cap rate sourcing? And would you expect your volume of acquisitions in 2023 to be lower or higher than 2022? Gary A. Shiffman Trying to grab the paperwork here. I think that we don’t typically provide guidance towards acquisitions and, of course, capital marketplace activities. We’ve discussed the fact that cost of capital is such that we have sharpened our pencil razor thin. I don’t believe we’ll lose any opportunities because Sun always has a seat at the table and just about all of the sellers will reach out to Sun, either directly or through a relationship or brokerage. Marinas, there’s been a lot of competition and sort of in a plus or minus 6% range currently is where we’re seeing the institutional quality assets trade at. So it’s going to take a real opportunity. It has accretiveness and embedded growth where we can justify deploying capital in this environment and deliver the kind of growth our stakeholders are used to. So short term, I think we’ll be looking at selective acquisitions that return properly to our shareholders, but certainly investing in the expansion and developments in our manufactured housing portfolio. Anthony Franklin Powell Got it. Maybe a follow-up on that in terms of the development sites. How construction costs change on those? And how is kind of the ROI profile of your development sites evolved the past 12 months? Gary A. Shiffman Yes, that’s a great question. We certainly saw the cost of development spike up through the pandemic, short supply, supply chain, et cetera. We have begun to see it decline. We’re looking to build our new developments to a high single-digit unlevered IRR upon stabilization. Currently, we’ve adjusted our returns to low double digit, in part because of the large rental increases as a reflection of CPI and inflation. So as we model out going forward, our going in rents are higher than we originally modeled them out. So we believe we can still quite develop, if you will, a lot more beneficially than we can acquire out in the marketplace as cap rates have not adjusted for manufactured housing, of course, because of the fundamentals that investors see in manufactured housing and because Sun, being one of the largest consolidator, has created a really [dearth] of acquisition opportunity there in manufactured housing. Operator As there are no further questions at this time, I would like to turn the floor back over to Gary Shiffman for closing comments. Gary A. Shiffman We always appreciate the opportunity to have these calls and speak about the business. Today marks a very special day, and really want to take this opportunity to thank John for his unbelievable stewardship, both as President and Chief Operating Officer since 2008, if I got that correct. And really look forward to John’s 10-year operating our communities, in particular, manufactured housing and being able to transfer that over to the 16,000 site inventory we now have to grow by. John Bandini McLaren Thank you. Gary A. Shiffman We look forward to our next call and certainly invite anyone to reach out to Fernando and his team with any follow-up questions. Thank you, everybody. Operator Thank you for your participation in today’s conference. This does conclude the company’s remarks. You may now disconnect your lines. ## |
|||||||||||||||||||||||||||||||||||||||||||||||||||||||||||||||||||||||||||||||||||||||||||||||||||||||||||||||||||||||||||||||||||||||||||||||||||||||||||||||||||||||||||||||||||||||||||||||||||||||||||||||||||||||||||||||||||||||||||||||||||||||||||||||||||||||||||||||||||||||||||||||||||||||||||||||||||||||||||||||||||||||||||||||||||||||||||||||||||||||||||||||||||||||||||||||||||||||||||||||||||||||||||||||||||||||||||||||||||||||||||||||||||||||||||||||||||||||||||||||||||||||||||||||||||||||||||||||||||||||||||||||||||||||||||||||||||||||||||||||||||||||||||||||||||||||||||||||||||||||||||||||||||||||||||||||||||||||||||||||||||||||||||||||||||||||||||||||||||||||||||||||||||||||||||||||||||||||||||||||||||||||||||||||||||||||||||||||||||||||||||||||||||||||||||||||||||||||||||||||||||||||||||||||||||||||||||||||||||||||||||||||||||||||||||||||||||||||||||||||||||||||||||||||||||||||||||||||||||||||||||||||||||||||||||||||||||||||||||||||||||||||||||||||||||||||||||||||||||||||
Note: the graphic below is part of the MHProNews Part II analysis.
It was not provided by Sun or the media reports on Sun cited above.

Part II Additional Information with More MHProNews Analysis and Commentary in Brief
For those with Warren Buffett style attention spans that don’t mind investing 5 or 6 hours reading such information, the roughly 1.2 hours of reading that this article represents is modest. MHProNews readers in 2022 were, as has been reported in our year end snapshots, far more engaged than readers of mainstream news sites. Metaphorically drinking deeply of available information has a compounding benefit, says Buffett. That is a notion that we would concur with him on, though we editorially disagree with some of Buffett’s business tactics.
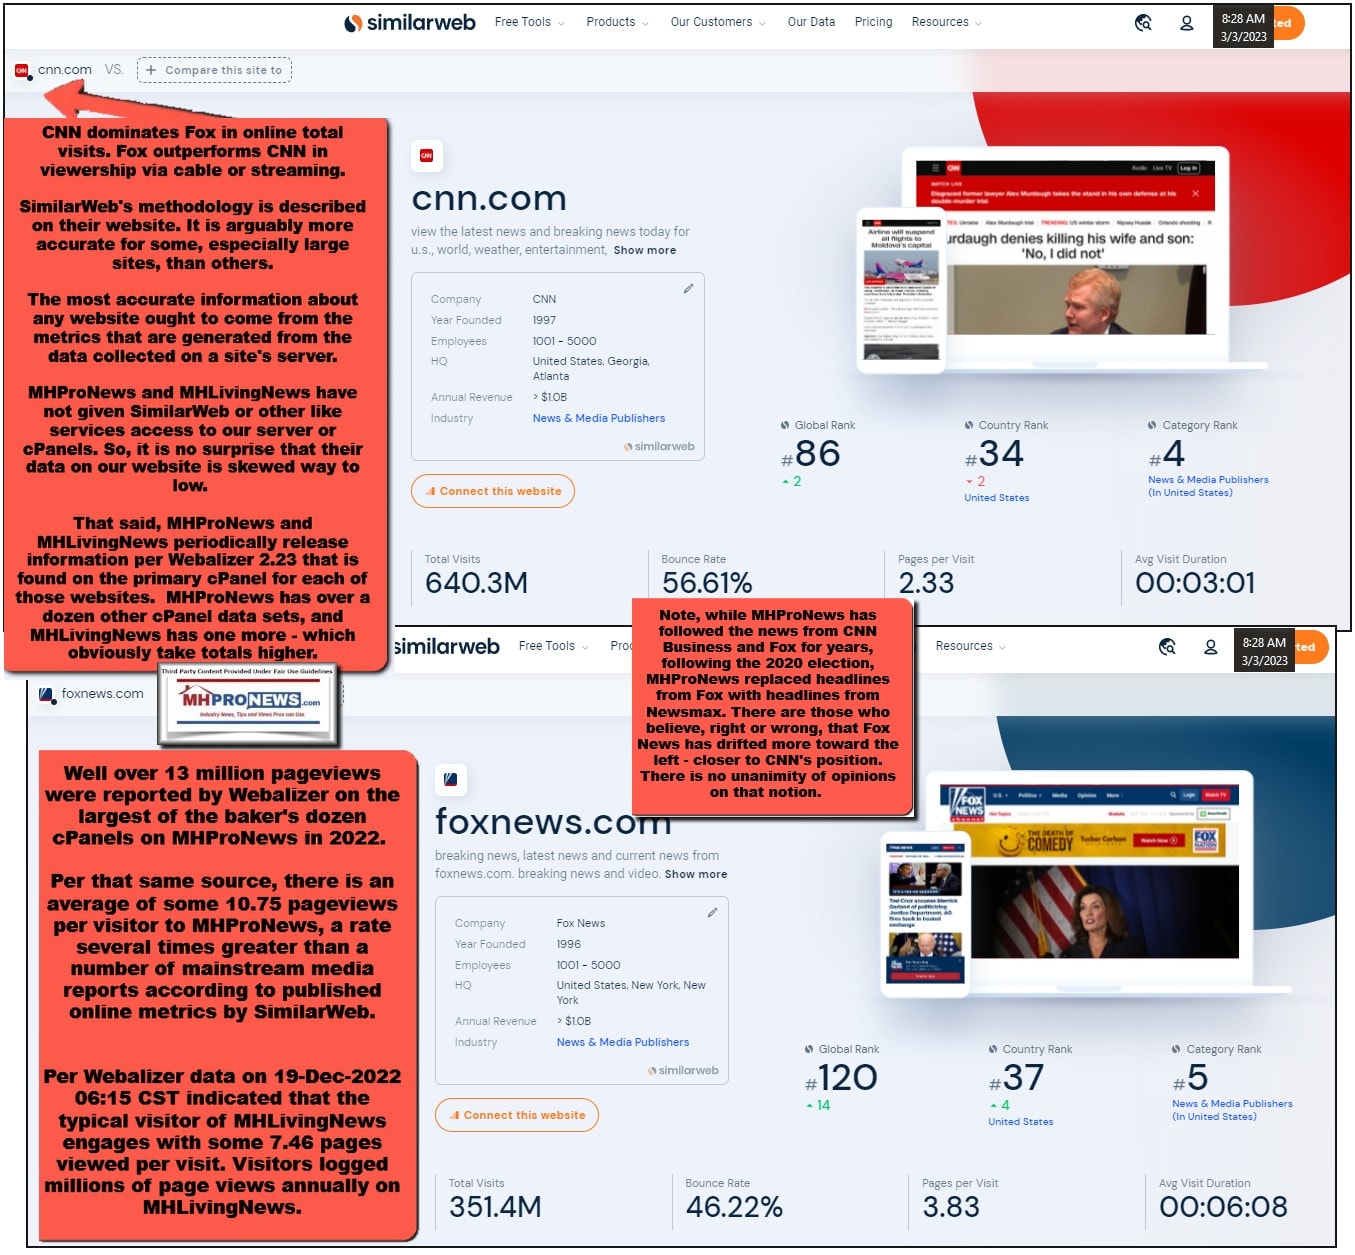

To objectively unpack Sun’s performance, we could spend several more hours. That said, to boil matters down for the purpose of this analysis of an already lengthy report, the following points are useful. In no particular order of importance are the following observations.
- 1) There are obvious areas that Sun get ‘good results’ from an investor perspective. They speak for themselves in the data and related commentary above.
- 2) Their stated ESG stance is arguably problematic, given the increased – and often negative attention – that ESG is facing in states like Florida, where Sun has a significant presence.
- 3) It is useful to consider the implications of several remarks.
- 4) It is also useful to note what is not mentioned by Sun’s management in their statements. When they talk about ‘transparency’ above – and then seem to fail in being fully transparent in some arenas – that bears notice.
- 5) For instance. They tout that ‘developing is in their DNA.’ If so, then why have they failed to leverage their legal resources to get the Manufactured Housing Improvement Act (MHIA) of 2000’s so-called “enhanced preemption” provision implemented? As a company that takes a long term view, while there might be a legal cost short term to deploying that as part of their development strategy, in the long run, it could result in numerous opportunities for expansion more rapidly and at a lower cost than site builders might experience. The research by the Manufactured Housing Working Group linked below sheds light on that point. Put differently, Sun’s bottom line is in the mid-to-longer term is arguably harmed by their strategy. The research linked below sheds light on why that is so.


- 6) So, Sun bears some share of the responsibility for failing to press MHI in its claimed support of getting federal enhanced preemption enforced. The National Housing Conference (NHC) graphic with MHProNews commentary linked here reflects the sharp rise in factory-built sales in California when state preemption went into effect. If HUD and/or other legal/lobbying efforts caused federal preemption for manufactured housing to suddenly and routinely be honored by local jurisdictions (not to mention the possible benefits of using AFFH for a similar effect), there could be a 6 to 7 fold increase in new HUD Code manufactured home sales in just a few years. That is further supported by data from Freddie Mac that says some 25 million American renters are ‘mortgage ready’ and could qualify to buy a manufactured home now.
- 7) There are an array of implications from those facts. Is it a surprise, then, that no one with Sun mentioned “preemption” in their comments provided above? Or that no one for Sun mentioned the “Duty to Serve” (DTS) manufactured housing that was also mandated by Congress but is going unenforced?
- 8) For that matter, why aren’t those analysts raising those issues and asking those questions during earnings calls?
- 9) Some might argue that Sun would be risking its ‘moat’ if federal preemption under the MHIA or if DTS were being robustly enforced. But a mathematical (meaning, good business) argument could be forged that consumers of affordable housing could benefit if Sun and other deep-pockets MHI members successfully pressed for the enforcement of DTS and federal enhanced preemption. As Shiffman himself said in 2019, there are times that a new development is more lucrative than consolidation – if that acquisition is at a compressed cap rate.
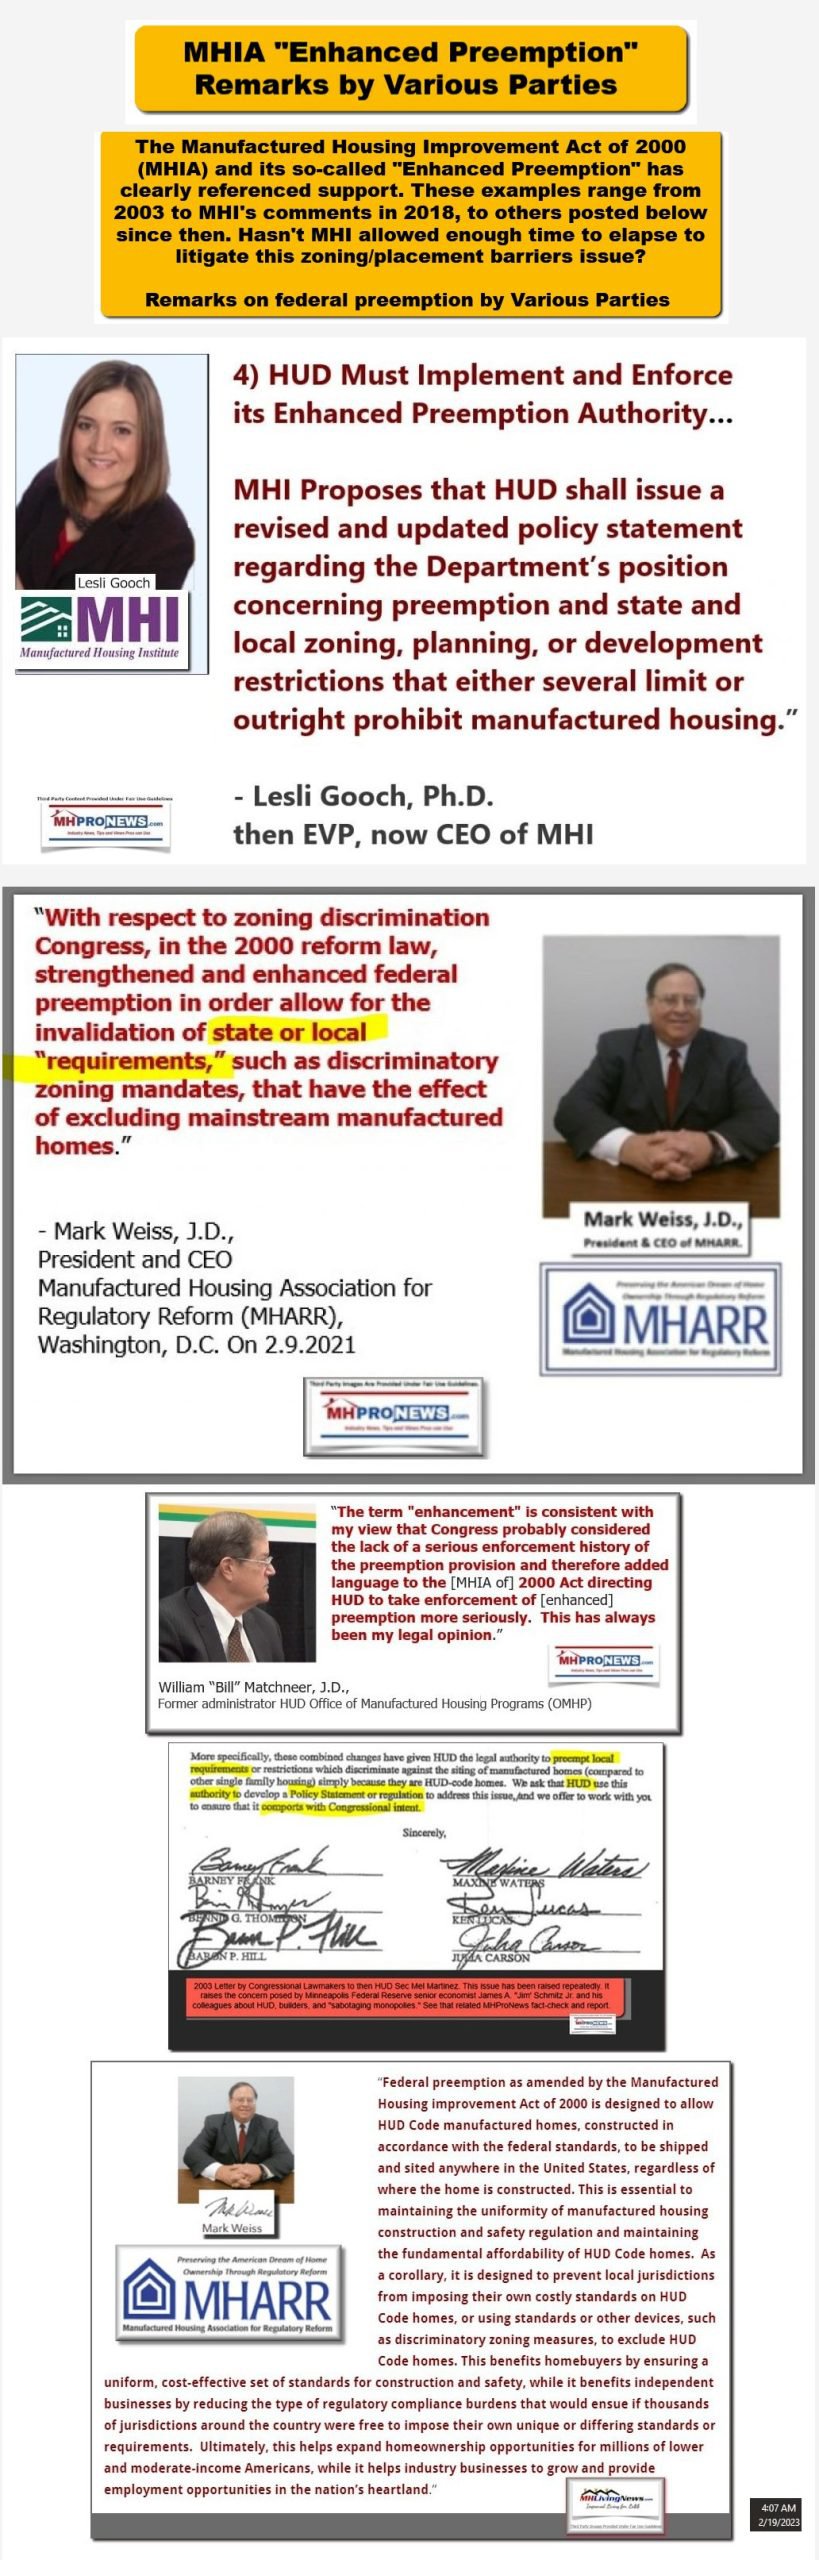

- 10) For larger MHI insider brands, the case can be made that they want widespread ignorance on such subjects.
- 11) In an Orwellian sense, “ignorance (by others) is strength” for insiders that are consolidators.
- 12) MHProNews plans a deeper dive into some of these remarks in a future report. But for now, the facts, comments, and relevant related insights provided herein could point to a somewhat different business model which could be lucrative for investors but also may benefit potentially millions of renters and current manufactured home owners.
- 13) Disclosures: MHProNews holds no position in this firm nor other tracked stocks. That said, this writer did a project some years ago for Sun Communities in the Houston, TX market. I’ve met with several of Sun’s top management during that time. Briefly, while they said they were impressed with the results, they implemented no changes and explained why. One may wonder if they ever think about that discussion?

See the linked and related reports to learn more.


Related remarks by fellow MHI member, Frank Rolfe.


to a larger size. To return to this page, X out (close) the window, or depending on the device, you may need to use your back key, escape key (Esc), or follow the prompts.

Part III. Daily Business News on MHProNews Markets Segment
The modifications of our prior Daily Business News on MHProNews format of the recap of yesterday evening’s market report are provided below. It still includes our signature left (CNN Business) and right (Newsmax) ‘market moving’ headlines. The macro market moves graphics will provide context and comparisons for those invested in or tracking manufactured housing connected equities.
In minutes a day readers can get a good sense of significant or major events while keeping up with the trends that are impacting manufactured housing connected investing.
Reminder: several of the graphics on MHProNews can be opened into a larger size. For instance: click the image and follow the prompts in your browser or device to OPEN In a New Window. Then, in several browsers/devices you can click the image and increase the size. Use the ‘x out’ (close window) escape or back key to return.

Headlines from left-of-center CNN Business – from the evening of 3.3.2023
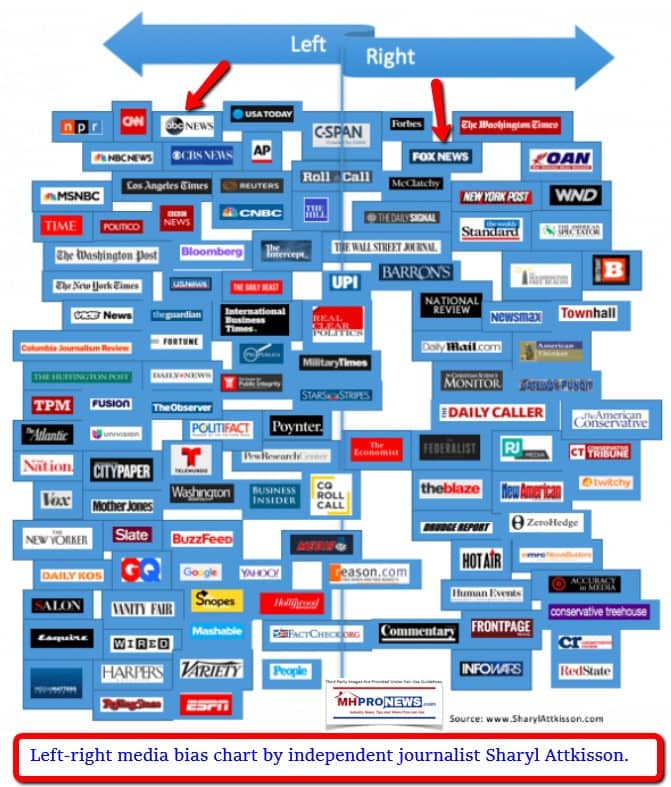
- Car of the future?
- Ford applies for patent on car that can automatically repossess itself
- Facebook revamps controversial content moderation process for VIPs
- Girl Scouts’ sold-out cookie is available on eBay. The Scouts are not pleased
- Amazon is pausing construction on its second headquarters in Virginia
- Russia may run out of money in 2024, says oligarch
- Almost all S&P 500 companies reported earnings. The results aren’t great
- This game show app was an overnight sensation, and crashed just as fast
- BTS mastermind on K-pop deal: We’re not ‘trying to take over the whole industry’
- Adani shares soar as US investor steps in
- Norfolk Southern CEO sells stock and sets up scholarship fund for East Palestine
- Nigeria’s chaotic banknote switch ruled invalid by top court
- How the market has changed in the 20+ years I’ve covered it
- Fair and Balanced? Murdoch’s private messages show Fox News was instructed to help Republicans
- US adds Chinese genetics firms to trade blacklist over surveillance allegations
- Porn Zoom bomb forces cancellation of Fed’s Waller event
- Ford F-150 Lightning electric truck production to restart March 13
- ExxonMobil sued after a Black employee allegedly discovered a noose at work. It was the fifth at the same facility
- Elizabeth Holmes wants to delay her prison sentence after giving birth to her second child
- NTSB: FedEx plane was only 150 feet off ground when disaster was averted
- GoodRx shared sensitive customer health information. Here’s what happens next
- Silvergate Capital shares plunge as bank reveals doubts about its viability
- #BoycottHersheys spreads on Twitter over Women’s Day campaign
- DOJ launches new effort to target corporate sanctions evasion
- Democratic senators urge Meta not to market its metaverse app to teens
Notice: the graphic below can be expanded to a larger size.
See the instructions below the graphic below or click the image and follow the prompts.

Headlines from right-of-center Newsmax 3.3.2023
- Hunter Biden’s Firm Aligned With Security Threat to US in 2015
- DirecTV Censors Newsmax
- Ruddy at CPAC: Newsmax ‘Critical’ for America’s Future
- Comer to Newsmax: Democrats Are All for Censoring Conservative Speech
- Dean Cain: DirecTV Doesn’t Want ‘Free Exchange’ of Voices | video
- Waltz: Congress Should ‘Intervene’ in DirecTV/Newsmax
- Bean, Letlow: Disheartened by Censorship | video
- Vance: DirecTV Wrong to Deplatform ‘Important Voice’ | video
- Dusty Johnson: DirecTV Acting Like CCP
- More Stories on AT&T DirecTV Censorship
- Newsmax TV
- Tenney: Immigration ‘Real Crisis’ at Northern Border
- Zinke: CPAC Young People Are ‘Front Line’ in Battle for America | video
- Steube: Wouldn’t Be Shocked If COVID Leak Intentional
- Matt Schlapp: Conservatives Tired of ‘Half-Woke’ Deals | video
- Wilson: Right to Work Bill Would Help Workers | video
- Van Duyne: Biden Doesn’t Grasp Fentanyl Crisis | video
- Johnson: Senate Call to Release COVID Intel Positive | video
- Murphy: Biden Failing With China | video
- Former AG Whitaker: Garland Extends DOJ Politicization | video
- More Newsmax TV
- Newsfront
- Angry Ohio Residents Confront Railroad Over Health Fears
- Residents who say they’re still suffering from illnesses nearly a month after a train carrying toxic chemicals derailed in Ohio confronted the railroad’s operator Thursday at a town forum, demanding to know whether they’d be relocated from homes they’re afraid to live…… [Full Story]
- Hunter Biden’s Firm Aligned With Security Threat to US in 2015
- Hunter Biden, the son of President Joe Biden, has come under renewed [Full Story]
- CFO Warns NewsGuard About Targeting Conservative Media
- Florida’s Chief Financial Officer Jimmy Patronis is warning left-wing [Full Story]
- More Than Half the World Will Be Overweight or Obese by 2035
- More than half of the world’s population will be overweight or obese [Full Story]
- US Announces $400 Million in Additional Military Aid to Ukraine
- The U.S. on Friday announced another round of military aid for [Full Story]
- Related
- US, Germany Moving in Lockstep on Ukraine, Biden Says Alongside Scholz
- One Year Into Ukraine War, Bodies Dug Up in Once-Occupied Town
- Lessons for US Politicians in Netanyahu’s Israel Protest Response
- Political analysts say U.S. politicians could learn a lesson from the [Full Story] | Platinum Article
- Amy Grant: Faith Provided Strength After Bike Accident
- Amy Grant said faith gave her strength while recovering from a bike [Full Story]
- Fed ‘Acutely Aware’ of Strain Inflation Is Causing
- The U.S. Federal Reserve is “acutely aware” of the challenges high [Full Story]
- Colon Cancer Rising in Younger People
- Colon cancer continues to rise among younger U.S. adults, with the [Full Story]
- Housing Affordability at Historic Low
- Only 21% of U.S. households could afford the homes listed for sale in [Full Story]
- US, South Korea Announce Largest Field Exercises in 5 Years
- The South Korean and U.S. militaries announced Friday they will hold [Full Story]
- Morgan Stanley’s Top 5 AI Stock Picks
- Morgan Stanley’s top five stock picks to ride the $5.9 trillion [Full Story]
- Florida Man Dies from Brain-Eating Amoeba Infection
- A brain-eating amoeba has killed a Florida man, state health [Full Story]
- Ford to Raise Production as US Auto Sales Start to Recover
- Ford will increase production of six models this year, half of them [Full Story]
- 70 Years After Death, Stalin’s Polarizing Legacy Looms Large
- On the eve of the 70th anniversary of Josef Stalin’s death, attitudes [Full Story]
- Transgender Pastor Claims Bias, Sues Lutheran Denomination
- The Rev. Megan Rohrer, who was elected as the first openly [Full Story]
- Utah Lawmakers Advance Abortion Clinic Ban Over Protests
- Lawmakers advanced a measure to limit where people can get abortions [Full Story]
- Texas A&M System Bans Diversity Statements From Hiring, Admission Policies
- The Texas A&M University system has been directed to stop asking [Full Story]
- Rasmussen Poll: Most Say Biden Too Old for Second Term
- A strong majority, 59% of likely voters say President Joe Biden will [Full Story]
- Nikki Haley to Hold First Presidential Rally in Myrtle Beach
- Former South Carolina Gov. Nikki Haley will hold the first rally of [Full Story]
- Black Vietnam Vet at Last Getting His Due: Medal of Honor
- Nearly 60 years after he was first recommended for the nation’s [Full Story]
- Jazz Innovator Wayne Shorter Dies at 89
- Wayne Shorter, the storied saxophonist considered one of America’s [Full Story]
- Israeli Officials Head to Washington for Talks on Iranian Nuclear Threat
- Two senior Israeli officials, Strategic Affairs Minister Ron Dermer [Full Story]
- How Did US Mistake ‘Havana Syndrome’ for Enemy Weapon?
- Though a new intelligence report dismissed the long-disputed theory [Full Story] | Platinum Article
- Pentagon Papers Leaker Ellsberg Diagnosed With Terminal Cancer
- Daniel Ellsberg, the whistleblower who leaked the “Pentagon Papers” [Full Story]
- Israel Discovers Inscription Bearing Persian King Darius the Great’s Name
- An inscription with the name of King Darius the Great was discovered [Full Story]
- Biden Announces Visit to East Palestine Amid Backlash
- President Joe Biden pledged to “at some point” visit East Palestine, [Full Story]
- Walgreens Won’t Dispense Abortion Pills in Some States Where They Remain Legal: Politico
- Walgreens Boots Alliance Inc. will not dispense abortion pills in [Full Story]
- Ethics Office: AOC Likely Accepted ‘Impermissible’ Gifts at Met Gala
- The Office of Congressional Ethics determined Thursday that there is [Full Story]
- No Bail for Pennsylvania Man With Explosives in Suitcase
- A Pennsylvania man admitted packing explosive materials, fuses and a [Full Story]
- DeSantis, Trump Set to Visit Iowa, Ramping Up 2024 Moves
- DeSantis, Trump Set to Visit Iowa, Ramping Up 2024 Moves
- Florida Gov. Ron DeSantis and former President Donald Trump are each [Full Story]
- Amazon Hates when People in Florida Do This, but They Can’t Stop You
- Morgan Stanley’s Top 5 AI Stock Picks
- Morgan Stanley’s top five stock picks to ride the $5.9 trillion artificial intelligence wave include companies serving up AI assistants and more intuitive search engines, CNBC reports…. [Full Story]
- Tesla Gets $330M Tax Deal for Nevada Expansion, Truck Plant
- Stocks Rally, on Pace for 1st Winning Week in Last 4
- Larry Bell: Biden Speeds US to China’s Traps, Time to Take Away His Keys
- Trevor Gerszt: Do You Have Enough Saved for Retirement?
- More Finance
- Health
- Colon Cancer Rising in Younger People
- Colon cancer continues to rise among younger U.S. adults, with the American Cancer Society reporting a doubling of cases in people younger than 55 in about 25 years. Also, significantly more Americans are being diagnosed with advanced stages of the disease, the cancer…… [Full Story]
- WHO Urges Countries to Share Data About COVID Origins
- Baby’s Death Tied to Contaminated Breast Pump, CDC Says
- Conquer Your Food Cravings for Good
- Burt’s Bees TikTok Challenge Can Damage Eyes
Notice: the graphic below can be expanded to a larger size.
See the instructions below the graphic below or click the image and follow the prompts.

2022 was a tough year for many stocks. Unfortunately, that pattern held true for manufactured home industry (MHVille) connected stocks too. See the facts, linked below.
====================================
Updated
-
-
- NOTE 1: The 3rd chart above of manufactured housing connected equities includes the Canadian stock, ECN, which purchased Triad Financial Services, a manufactured home industry finance lender.
- NOTE 2: Drew changed its name and trading symbol at the end of 2016 to Lippert (LCII).
- NOTE 3: Deer Valley was largely taken private, say company insiders in a message to MHProNews on 12.15.2020, but there are still some outstanding shares of the stock from the days when it was a publicly traded firm. Thus, there is still periodic activity on DVLY.
- Note 4: some recent or related reports to the REITs, stocks, and other equities named above follow in the reports linked below.
-


2023 …Berkshire Hathaway is the parent company to Clayton Homes, 21st Mortgage, Vanderbilt Mortgage and other factory-built housing industry suppliers.
· LCI Industries, Patrick, UFPI, and LP each are suppliers to the manufactured housing industry, among others.
· AMG, CG, and TAVFX have investments in manufactured housing related businesses. For insights from third-parties and clients about our publisher, click here.
Disclosure. MHProNews holds no positions in the stocks in this report.
· For expert manufactured housing business development or other professional services, click here.
· To sign up in seconds for our industry leading emailed headline news updates, click here.


That’s a wrap on this installment of “News Through the Lens of Manufactured Homes and Factory-Built Housing” © where “We Provide, You Decide.” © (Affordable housing, manufactured homes, stock, investing, data, metrics, reports, fact-checks, analysis, and commentary. Third-party images or content are provided under fair use guidelines for media.) (See Related Reports, further below. Text/image boxes often are hot-linked to other reports that can be access by clicking on them.)

By L.A. “Tony” Kovach – for MHProNews.
Tony earned a journalism scholarship along with numerous awards in history. There have been several awards and honors and also recognition in manufactured housing. For example, he earned the prestigious Lottinville Award in history from the University of Oklahoma, where he studied history and business management. He’s a managing member and co-founder of LifeStyle Factory Homes, LLC, the parent company to MHProNews, and MHLivingNews.com. This article reflects the LLC’s and/or the writer’s position and may or may not reflect the views of sponsors or supporters.