

From the most recent Sun Communities (SUI) investor presentations (linked further below) are two of the headline statements. ‘Compelling Supply – Demand Fundamentals’ said SUI’s IR pitch with ‘Virtually No New Supply Has Been Added for Years.’ Those remarks are by a prominent Manufactured Housing Institute (MHI) member with a board position (Sun Communities-SUI) saying the quiet part out loud.
It appears that whatever MHI has said in recent years about their desire to see the Manufactured Housing Improvement Act of 2000 (MHIA) and its enhanced preemption clause should get robust and consistent enforcement by HUD, the apparently unstated MHI agenda at MHI is in alignment with what MHI-NCC members Sun Communities (SUI), Equity LifeStyle Properties (ELS), Flagship Communities, and others in that trade group say that actually holds sway.
Who says?
Consider this summary from Bing AI (set in context in Part II, further below). Earlier in this Q&A with Bing AI, Sun Communities (SUI) and others were specifically named. Highlighting, bold, and spacing in what follows are added by MHProNews, but the text/remarks are per Bing AI.

However, there are several MHI members whose publicly stated investor or other information makes clear that enforcing federal preemption could undermine their business model 34.
Additionally, there are no articles or press releases by the MHI on their website that mention enhanced preemption under the Manufactured Housing Improvement Act 1.
By contrast, there are multiple articles on the MHARR website that mention enhanced preemption 24.
Similarly, some Manufactured Housing Institute linked trade media also routinely fail to mention the enhanced preemption provision of the Manufactured Housing Improvement Act of 2000 1.
By contrast, both the Manufactured Home Pro News and Manufactured Home Living News websites have multiple articles that specifically mention enhanced preemption as a tool for opening up more opportunities to sell more affordable manufactured housing 5 6”
So, by de facto allowing restrictions on new development, that dynamic yields a ‘Compelling Supply – Demand Fundamentals’ with ‘Virtually No New Supply Has Been Added for Years.’ In fact, per the known data, there are perhaps thousands of fewer manufactured home communities in existence nationally in 2023 than there were in 2000 (see that linked further below in the Q&A in Part II). All that follows can be framed with those insights and others that follow in mind.
The following (Part I) is Sun’s official press release with investor information for their quarterly and year to date (Y2D) information. It will reflect Sun’s admission that their manufactured home sales are down, among other financial insights.
Part II is additional information with more MHProNews analysis and commentary. It will provide the Sun IR presentation items referenced in the headline and above. It will also provided the full and wide-ranging context for the Bing AI Q&A by MHProNews. In our expert view, it could be one of the most important Q&A’s using Bing AI software to date from the perspective of thousands in the manufactured home industry pros and potentially millions of souls who want access to more affordable housing.
Part III is our Daily Business News on MHProNews macro-markets and manufactured housing connected equities updates.
Notice: unpacking the Sun Communities (SUI) report below should not be construed as an MHProNews endorsement or plug for that investment. Indeed, as a pull quote from Sun’s CEO Gary Shiffman herein will reflect, the case can be made that Sun has acknowledged that it could be perusing a business strategy that could be more rewarding to investors. That alternative Shiffman mentioned may also be less risky in terms of liability, could be better for their residents, and would offer a more genuine and scalable ‘solution’ to the U.S. affordable housing crisis. More on that in Part II.
Part I
Sun Communities, Inc.
Earnings Press Release & Supplemental Operating and Financial Data
For the Quarter and Nine Months Ended September 30, 2023 and 2022
| Forward-Looking Statements | i |
| Earnings Press Release and Guidance | ii |
| Overview | |
| Company Overview and Investor Information | 1 |
| Financial and Operating Highlights | 2 |
| Portfolio Overview | 3 |
| Financial Statements and Reconciliations to Non-GAAP Financial Measures | |
| Consolidated Balance Sheets | 4 |
| Consolidated Statements of Operations | 5 |
| Reconciliation of Net Income Attributable to SUI Common Shareholders to Core FFO | 6 |
| Reconciliation of Net Income Attributable to SUI Common Shareholders to NOI | 7 |
| Reconciliation of Net Income Attributable to SUI Common Shareholders to Recurring EBITDA | 8 |
| Supplemental Disclosure | |
| Real Property Operations – Total Portfolio | 9 |
| Real Property Operations – Same Property Portfolio | 10 |
| Other Operating Information | |
| Home Sales Summary | 13 |
| Operating Statistics for MH and Annual RVs (excluding UK Operations) | 13 |
| Investment Activity | |
| Acquisitions and Dispositions | 14 |
| Capital Expenditures and Investments | 15 |
| Capitalization | |
| Capitalization Overview | 16 |
| Summary of Outstanding Debt | 17 |
| Debt Analysis | 18 |
| Definitions and Notes | |
| Define and provide additional notes related to Non-GAAP financial measures and other capitalized terms | 19 |
Sun Communities, Inc.
Earnings Press Release & Supplemental Operating and Financial Data For the Quarter and Nine Months Ended September 30, 2023 and 2022 Forward-Looking Statements:
This supplemental package contains various “forward-looking statements” within the meaning of the Securities Act of 1933, as amended (the “Securities Act”), and the Securities Exchange Act of 1934, as amended (the “Exchange Act”), and Sun Communities, Inc. (the “Company”) intends that such forward-looking statements will be subject to the safe harbors created thereby. For this purpose, any statements contained in this document that relate to expectations, beliefs, projections, future plans and strategies, trends or prospective events or developments and similar expressions concerning matters that are not historical facts are deemed to be forwardlooking statements. Words such as “forecasts,” “intends,” “intend,” “intended,” “goal,” “estimate,” “estimates,” “expects,” “expect,” “expected,” “project,” “projected,” “projections,” “plans,” “predicts,” “potential,” “seeks,” “anticipates,” “anticipated,” “should,” “could,” “may,” “will,” “designed to,” “foreseeable future,” “believe,” “believes,” “scheduled,” “guidance,” “target” and similar expressions are intended to identify forward-looking statements, although not all forward-looking statements contain these words. These forward-looking statements reflect the Company’s current views with respect to future events and financial performance, but involve known and unknown risks and uncertainties, both general and specific to the matters discussed in this document some of which are beyond the Company’s control. These risks and uncertainties may cause the Company’s actual results to be materially different from any future results expressed or implied by such forward-looking statements. In addition to the risks described under “Risk Factors” contained in the Company’s Annual Report on Form 10-K for the year ended December 31, 2022 and in the Company’s other filings with the Securities and Exchange Commission from time to time, such risks, uncertainties and other factors include those described under the heading “Cautionary Statement Regarding Forward-Looking Statements” in the accompanying press release.
Readers are cautioned not to place undue reliance on these forward-looking statements, which speak only as of the date the statement was made. The Company undertakes no obligation to publicly update or revise any forward-looking statements included or incorporated by reference into this document, whether as a result of new information, future events, changes in the Company’s expectations or otherwise, except as required by law.
Although the Company believes that the expectations reflected in the forward-looking statements are reasonable, the Company cannot guarantee future results, levels of activity, performance or achievements. All written and oral forward-looking statements attributable to the Company or persons acting on the Company’s behalf are qualified in their entirety by these cautionary statements.
Note on Non-GAAP Measures:
This document includes information regarding various non-GAAP supplemental performance measures, including funds from operations (“FFO”), Core FFO, net operating income (“NOI”), earnings before interest, tax, depreciation and amortization (“EBITDA”) and Recurring EBITDA. For information on these non-GAAP measures, please refer to “Reconciliation of Net Income Attributable to SUI Common Shareholders to Core FFO,” “Reconciliation of Net Income Attributable to SUI Common Shareholders to NOI,” “Reconciliation of
Net Income Attributable to SUI Common Shareholders to Recurring EBITDA,” and “Definitions and Notes.”
EARNINGS PRESS RELEASE
October 25, 2023
Sun Communities, Inc. Reports 2023 Third Quarter and Year-to-Date Results
Net Earnings per Diluted Share of $1.31 for the Quarter
Core FFO per Share of $2.57 for the Quarter Exceeded the High-End of Guidance Range
Total Same Property NOI Grew by 6.7% for the Quarter over the 2022 Period, Exceeding the High-End of Guidance Range by 220 Basis Points
Strong Demand and Effective Expense Management Continue to Drive Outperformance
Same Property Adjusted Occupancy for MH and RV Increased by 170 Basis Points, Year-over-Year
Transient-to-Annual RV Site Conversions of nearly 537 Sites for the Quarter and 1,815 for the Year-to-Date
Revising Full-Year Core FFO per Share Guidance for 2023 to $7.05 – $7.13
Increasing Guidance Range for Full-Year Total Same Property NOI Growth to 6.0% – 6.4%
Establishing Preliminary Guidance for 2024 Rental Rate Increases of 5.4% for MH, 6.5% for Annual RV, and 5.6% for Marina in North America, and 7.1% for UK
Southfield, Michigan, October 25, 2023 – Sun Communities, Inc. (NYSE: SUI) (the “Company” or “SUI”), a real estate investment trust (“REIT”) that owns and operates, or has an interest in, manufactured housing (“MH”) and recreational vehicle (“RV”) communities and marinas (collectively, the “properties”), today reported its third quarter results for 2023.
Financial Results for the Quarter and Nine Months Ended September 30, 2023
- For the quarter ended September 30, 2023, net income attributable to common shareholders was $163.1 million, or $1.31 per diluted share, compared to net income attributable to common shareholders of $162.6 million, or $1.32 per diluted share for the same period in 2022.
- For the nine months ended September 30, 2023, net income attributable to common shareholders was $222.8 million, or $1.79 per diluted share, compared to net income attributable to common shareholders of $237.3 million, or $1.97 per diluted share, for the same period in 2022.
Non-GAAP Financial Measures
- Core Funds from Operations (“Core FFO”) for the quarter and nine months ended September 30, 2023, were $2.57 per common share and dilutive convertible securities (“Share”) and $5.76 per Share, respectively.
- Same Property Net Operating Income (“NOI”) increased by 6.7% and 6.6% for the quarter and nine months ended September 30, 2023, respectively, as compared to the corresponding periods in 2022.
“In the third quarter, we again delivered strong performance in our core real property portfolio, with Same Property NOI growth and Core FFO exceeding our expectations,” said Gary A. Shiffman, Chairman, President and CEO. “This strength was exhibited across Manufactured Housing, RV and Marinas, all of which demonstrate the continued favorable backdrop of high demand and limited supply. Furthermore, we are positioned for ongoing organic growth with 2024 expected rental rate increases of approximately 5.4% for MH, 6.5% for RV, and 5.6% for Marina in North America and 7.1% for UK.” He continued, “Our current objectives include implementing select changes to help our best-in-class portfolio deliver the FFO per share growth Sun shareholders historically have enjoyed. These changes include selective capital recycling opportunities and using the proceeds to de-lever. With the strength of our core business, which has a positive track record throughout economic cycles, and our focus on our durable cash flow business, we remain confident in our ability to create shareholder value.”
OPERATING HIGHLIGHTS
North America Portfolio Occupancy
- Total MH and annual RV occupancy was 97.2% at September 30, 2023, as compared to 97.1% at September 30, 2022.
- During the quarter ended September 30, 2023, the number of MH and annual RV revenue producing sites increased by 744 sites, as compared to an increase of 689 sites during the corresponding period in 2022, an 8.0% increase.
- Transient-to-annual RV site conversions totaled 537 sites during the third quarter of 2023 and account for 72.2% of the revenue producing site gains. Total transient-to-annual RV site conversions totaled 1,815 for the nine months ended September 30, 2023.
Same Property Results
For the properties owned and operated by the Company since at least January 1, 2022, the following table reflects the percentage changes for the quarter and nine months ended September 30, 2023:
Quarter Ended September 30, 2023
MH RV Marina Total
| Revenue | 7.4 % | 2.2 % | 8.4 % | 5.5 % |
| Expense | 5.7 % | (0.8) % | 7.4 % | 3.0 % |
| NOI | 8.0 % | 4.1 % | 8.9 % | 6.7 % |
Nine Months Ended September 30, 2023
MH RV Marina Total
| Revenue | 6.8 % | 3.6 % | 9.4 % | 6.2 % |
| Expense | 8.5 % | 3.1 % | 5.1 % | 5.5 % |
| NOI | 6.2 % | 3.9 % | 11.5 % | 6.6 % |
| Number of Properties | 288 | 161 | 119 | 568 |
Same Property adjusted blended occupancy for MH and RV increased by 170 basis points to 98.8% at September 30, 2023, from 97.1% at September 30, 2022.
INVESTMENT ACTIVITY
During the quarter ended September 30, 2023, the Company:
- Expanded its existing communities by nearly 170 sites.
- Delivered over 70 sites at one ground-up development property.
BALANCE SHEET, CAPITAL MARKETS ACTIVITY AND OTHER ITEMS
As of September 30, 2023, the Company had $7.7 billion in debt outstanding with a weighted average interest rate of 4.1% and a weighted average maturity of 6.8 years. At September 30, 2023, the Company’s net debt to trailing twelve-month Recurring EBITDA ratio was 6.1 times.
During the quarter, the Company entered into interest rate swap contracts to hedge variable rate borrowings of $125.0 million in aggregate under its senior credit facility. The interest rate swaps lock in a weighted average SOFR rate of 4.771%, and inclusive of spread, an all-in rate of 5.681% through the maturity date of April 7, 2026.
Subsequent to the quarter, the Company:
- Entered into an interest rate swap contract to hedge variable rate borrowings of $25.0 million under its senior credit facility. The interest rate swap lock in a weighted average SOFR rate of 4.684%, and inclusive of spread, an all-in rate of 5.594% through the term loan maturity date of April 7, 2026.
- Terminated one SOFR interest rate swap hedging variable rate borrowings of $50.0 million under its senior credit facility and received a cash settlement payment of $6.0 million. The net accumulated gain is included in Accumulated other comprehensive income on the Company’s Consolidated Balance Sheets, and will be amortized as a reduction to Interest expense over the term of the hedged transaction.
- Entered into a new mortgage term loan for $252.8 million that matures in November 2030 and bears interest at a fixed rate of 6.49%. The proceeds were used to repay $117.8 million of mortgage term loans that mature in 2023 and pay down amounts drawn under the Company’s senior credit facility.
- Sold its 41.8 million share position in Ingenia Communities Group (ASX: INA), generating $102.5 million of proceeds, net of underwriting and other estimated fees, with an estimated realized loss of $9.0 million. The proceeds were used to pay down amounts drawn under the Company’s senior credit facility.
UK Notes Receivable from Real Estate Operators
From time to time, the Company extends loans to third party real estate developers and operators to facilitate the Company’s potential acquisition and development pipeline. At September 30, 2023, the Company had a $361.1 million note receivable due from Royale Holdings Group HoldCo Limited, a real estate development owner / operator in the UK, and certain other parties (the “Note”). As of the same date, the borrowings under the Note bear interest at a weighted average rate of 12.4%. The Note is not related to the Company’s manufactured housing portfolio in the UK that operates under the Park Holidays brand.
Since inception, the Company has elected to measure the Note at fair value, using pricing models with the assistance of third-party valuation specialists, in accordance with Accounting Standards Codification Topic 820, “Fair Value Measurements and Disclosures.” The Company has also periodically engaged third party valuation specialists to appraise the collateral in order to assess the fair value of the Note.
The Note is collateralized by a first-priority security interest in three real estate properties and three MH manufacturers in the UK. The real estate collateral consists of MH development properties that comprised a significant majority of the total appraised value of all collateral securing the Note at September 30, 2023.
The Note matured on July 31, 2023, and remained due at September 30, 2023. On September 29, 2023, the Company appointed receivers over the real estate collateral and is assessing courses of action with respect to the other collateral.
The Company expects the receivers to start to market the real estate collateral for sale during the fourth quarter of 2023. Upon completion of the marketing process, the Company may elect to credit bid certain amounts due under the Note for the real estate collateral. If that were to occur and no third-party bid is received that exceeds the Company’s credit bid, the Company may elect to receive the real estate collateral in satisfaction of related amounts due under the Note. If a third-party bid is received that exceeds the Company’s bid, the Company will receive the cash proceeds of that bid up to the outstanding loan amount including interest, fees, and penalties, as applicable.
UK Contemplated Asset Sale
As previously disclosed, the Company had agreed to sell an operating MH community in the UK, Sandy Bay, in February 2023, which was expected to close in the third quarter. While the sale contract is no longer in effect, the asset remained classified as held for sale at September 30, 2023.
2023 GUIDANCE UPDATE
The Company is updating full-year 2023 and establishing fourth quarter 2023 guidance for diluted EPS and Core FFO per Share as follows:
Fourth Quarter
Full-Year Ending December 31, 2023 Ending
Reconciliation of Diluted EPS to Core FFO per Share Prior FY Guidance Revised FY Range December 31, 2023
| Diluted EPS | $ | 2.11 $ | 2.25 $ | 1.92 $ | 2.00 $ | 0.12 $ | 0.20 |
| Depreciation and amortization | 5.07 | 5.07 | 5.06 | 5.06 | 1.26 | 1.26 | |
| Distributions on preferred OP units | 0.09 | 0.09 | 0.09 | 0.09 | 0.02 | 0.02 | |
| Noncontrolling interest | 0.11 | 0.11 | 0.09 | 0.09 | (0.01) | (0.01) | |
| Gain on sale of assets | (0.28) | (0.28) | (0.25) | (0.25) | (0.07) | (0.07) | |
| Business combination expense and other acquisition related costs | 0.09 | 0.09 | 0.12 | 0.12 | 0.01 | 0.01 | |
| Other adjustments(a) | (0.10) | (0.10) | 0.02 | 0.02 | (0.05) | (0.05) | |
| Core FFO(b) per Share | $ | 7.09 $ | 7.23 $ | 7.05 $ | 7.13 $ | 1.28 $ | 1.36 |
- Other adjustments consist primarily of deferred taxes, changes in remeasurement (gains) / losses, contingent legal and insurance gains and other items presented in the table that reconciles Net income attributable to SUI common shareholders to Core FFO on page 6.
- The Company’s updated guidance translates forecasted results from operations in the UK using the relevant exchange rate in effect provided in the 2023 Guidance Assumptions table presented below. The impact of fluctuations in Canadian and Australian foreign currency rates on revised and initial guidance are not material.
The $7.09 per Share midpoint of the revised full-year guidance range is 1.0% lower than the prior range provided in July, primarily reflecting higher interest expense related to the UK Note remaining outstanding and lower expected transient RV revenues.
For the fourth quarter ending December 31, 2023, the Company’s guidance ranges assume Total Same Property NOI growth of 4.4% – 5.9%. The midpoints of Same Property NOI growth for the fourth quarter ending December 31, 2023 are 5.1% for Manufactured Housing, 3.6% for RV and 6.2% for Marina.
The assumptions underlying the Company’s revised 2023 full-year guidance are as follows:
FY 2022 Expected Change in 2023
2023 Guidance Assumptions (dollars in millions) Results Prior FY Guidance Revised FY Range
| Consolidated Portfolio: | |||
| Total real property NOI | 6.1% – 6.9% | 6.9% – 7.1% | |
| Service, retail, dining and entertainment NOI | $50.4 – $52.9 | $51.2 – $52.2 | |
| North America home sales contribution to Core FFO(a) | $18.9 – $21.7 | $19.4 – $20.5 | |
| Interest income(b) | N/A | $44.8 – $45.1 | |
| Brokerage commissions and other, net(c) | N/A | $50.9 – $51.4 | |
| General and administrative expenses | ($255.4) – ($249.9) | ($253.6) – ($252.1) | |
| UK | |||
| UK real property NOI(d) | $63.6 – $65.6 | $64.1 – $65.1 | |
| UK home sales NOI | $65.7 – $75.4 | $68.2 – $72.2 | |
| UK NOI | $129.3 – $141.0 | $132.3 – $137.3 | |
| Same Property Portfolio(e) | |||
| MH NOI (288 properties) | $569.2 | 5.2% – 5.8% | 5.8% – 6.1% |
| RV NOI (161 properties) | $281.8 | 3.4% – 4.6% | 3.5% – 4.2% |
| Marina NOI (119 properties) | $210.8 | 8.0% – 9.0% | 10.0% – 10.3% |
| Total Same Property Pool (568 Properties): | |||
| Revenue from real property | $1,600.4 | 6.2% – 6.5% | 5.8% – 6.0% |
| Property operating expenses(f)(g) | $538.6 | 7.2% – 7.9% | 5.2% – 5.4% |
| Same Property NOI | $1,061.8 | 5.3% – 6.1% | 6.0% – 6.4% |
| Exchange rates in effect at: | December 31, 2022 | June 30, 2023 | September 30, 2023 |
| U.S. Dollar (“USD”) / Pound Sterling (“GBP”) | 1.21 | 1.27 | 1.22 |
| USD / Canadian Dollar (“CAD”) | 0.74 | 0.75 | 0.74 |
| USD / Australian Dollar (“AUS”) | 0.68 | 0.66 | 0.64 |
Footnotes to 2023 Guidance Assumptions
| (a) | FFO from home sales in North America is net of home selling expenses and includes the gross profit from new and certain pre-owned home sales. Gross profit from pre-owned home sales of depreciated homes is excluded. |
| (b) | Interest income recognized from the UK Note during the first nine months ended September 30, 2023, totaled $27.9 million, or $0.22 per Share. No interest income from the UK Note is included in the Company’s fourth quarter guidance. The following table summarizes the interest income contribution inclusive of fourth quarter guidance: |
| (c) | For the third quarter and nine months ended September 30, 2023, Brokerage commissions and other, net includes recognition of $12.9 million of business interruption proceeds, which nets against accrued ‘Loss of earnings – catastrophic event-related charges, net’ in the Reconciliation of Net Income Attributable to SUI Common Shareholders to Core FFO table. |
| (d) | UK Real Property NOI is included in the Total Real Property NOI forecast and the properties are excluded from the 2023 Same Property pool. |
| (e) | The amounts in the table reflect constant currency, as currency figures included within the 2022 actual amounts have been translated at the assumed exchange rate used for 2023 guidance. |
| (f) | Total Same Property results net $101.1 million of utility revenue for 2022 actual results and $109.7 million for 2023 guidance against the related utility expense in property operating expenses. |
| (g) | 2022 actual results exclude $1.3 million of expenses incurred at recently acquired properties to bring them up to the Company’s standards. The improvements included items such as tree trimming and painting costs that do not meet the Company’s capitalization policy. |
Seasonality (Updated as of October 25, 2023) 1Q23 2Q23 3Q23 4Q23
| Same Property NOI: | ||||
| MH | 25% | 25% | 25% | 25% |
| RV | 16% | 25% | 42% | 17% |
| Marina | 20% | 27% | 30% | 23% |
| Total Same Property | 21% | 26% | 30% | 23% |
| UK NOI: | ||||
| Real property | 10% | 27% | 44% | 19% |
| Home sales | 18% | 35% | 33% | 14% |
| Total NOI from UK Operations | 14% | 31% | 38% | 17% |
| Consolidated Service, Retail, Dining and Entertainment NOI | 5% | 36% | 49% | 10% |
| Consolidated EBITDA | 19% | 27% | 34% | 20% |
| Core FFO per Share | 17% | 28% | 36% | 19% |
Preliminary 2024 Rental Rate Increases
The Company expects to realize the following rental rate increases, on average, during 2024:
Average 2024 Rental Rate Increases Expected
| Manufactured Housing: | |
| North America | 5.4% |
| UK | 7.1% |
| Annual RV | 6.5% |
| Marina | 5.6% |
The estimates and assumptions presented above represent a range of possible outcomes and may differ materially from actual results. These estimates include contributions from all acquisitions, dispositions and capital markets activity completed through October 25, 2023. These estimates exclude all other prospective acquisitions, dispositions and capital markets activity. The estimates and assumptions are forward-looking based on the Company’s current assessment of economic and market conditions and are subject to the other risks outlined below under the caption Cautionary Statement Regarding Forward-Looking Statements.
EARNINGS CONFERENCE CALL
A conference call to discuss third quarter results will be held on Thursday, October 26, 2023 at 2:00 P.M. (ET).
To participate, call toll-free at (877) 407-9039. Callers outside the U.S. or Canada can access the call at (201) 689-8470. A replay will be available following the call through November 9, 2023 and can be accessed toll-free by calling (844) 512-2921 or (412) 317-6671. The Conference ID number for the call and the replay is 13739128. The conference call will be available live on the Company’s website located at www.suncommunities.com. The replay will also be available on the website.
CAUTIONARY STATEMENT REGARDING FORWARD-LOOKING STATEMENTS
This press release contains various “forward-looking statements” within the meaning of the Securities Act of 1933, as amended (the “Securities Act”), and the Securities Exchange Act of 1934, as amended (the “Exchange Act”), and the Company intends that such forward-looking statements will be subject to the safe harbors created thereby. For this purpose, any statements contained in this document that relate to expectations, beliefs, projections, future plans and strategies, trends or prospective events or developments and similar expressions concerning matters that are not historical facts are deemed to be forward-looking statements. Words such as “forecasts,” “intends,” “intend,” “intended,” “goal,” “estimate,” “estimates,” “expects,” “expect,” “expected,” “project,” “projected,” “projections,” “plans,” “predicts,” “potential,” “seeks,” “anticipates,” “anticipated,” “should,” “could,” “may,” “will,” “designed to,” “foreseeable future,” “believe,” “believes,” “scheduled,” “guidance,” “target” and similar expressions are intended to identify forward-looking statements, although not all forward-looking statements contain these words. These forward-looking statements reflect the Company’s current views with respect to future events and financial performance, but involve known and unknown risks and uncertainties, both general and specific to the matters discussed in this document, some of which are beyond the Company’s control. These risks and uncertainties and other factors may cause the Company’s actual results to be materially different from any future results expressed or implied by such forward-looking statements. In addition to the risks described under “Risk Factors” contained in the Company’s Annual Report on Form 10-K for the year ended December 31, 2022, and in the Company’s other filings with the Securities and Exchange Commission, from time to time, such risks, uncertainties and other factors include, but are not limited to:
∙ Outbreaks of disease and related restrictions on business operations;
∙ Changes in general economic conditions, including inflation, deflation and energy costs, the real estate industry and the markets within which the Company operates;
∙ Difficulties in the Company’s ability to evaluate, finance, complete and integrate acquisitions, developments and expansions successfully;
∙ The Company’s liquidity and refinancing demands;
∙ The Company’s ability to obtain or refinance maturing debt;
∙ The Company’s ability to maintain compliance with covenants contained in its debt facilities and its unsecured notes;
∙ Availability of capital;
∙ Changes in foreign currency exchange rates, including between the U.S. dollar and each of the Canadian dollar, Australian dollar and
Pound sterling;
∙ The Company’s ability to maintain rental rates and occupancy levels;
∙ The Company’s ability to maintain effective internal control over financial reporting and disclosure controls and procedures;
∙ Increases in interest rates and operating costs, including insurance premiums and real estate taxes;
∙ Risks related to natural disasters such as hurricanes, earthquakes, floods, droughts and wildfires;
∙ General volatility of the capital markets and the market price of shares of the Company’s capital stock;
∙ The Company’s ability to maintain its status as a REIT;
∙ Changes in real estate and zoning laws and regulations;
∙ Legislative or regulatory changes, including changes to laws governing the taxation of REITs;
∙ Litigation, judgments or settlements, including costs associated with prosecuting or defending claims and any adverse outcomes;
∙ Competitive market forces;
∙ The ability of purchasers of manufactured homes and boats to obtain financing; and
∙ The level of repossessions by manufactured home and boat lenders;
Readers are cautioned not to place undue reliance on these forward-looking statements, which speak only as of the date the statement was made. The Company undertakes no obligation to publicly update or revise any forward-looking statements included or incorporated by reference into this document, whether as a result of new information, future events, changes in the Company’s expectations or otherwise, except as required by law.
Although the Company believes that the expectations reflected in the forward-looking statements are reasonable, the Company cannot guarantee future results, levels of activity, performance or achievements. All written and oral forward-looking statements attributable to the Company or persons acting on the Company’s behalf are qualified in their entirety by these cautionary statements.
Company Overview and Investor Information
The Company
Established in 1975, Sun Communities, Inc. became a publicly owned corporation in December 1993. The Company is a fully integrated REIT listed on the New York Stock Exchange under the symbol: SUI. As of September 30, 2023, the Company owned, operated, or had an interest in a portfolio of 670 developed MH, RV and Marina properties comprising approximately 180,170 developed sites and approximately 48,030 wet slips and dry storage spaces in the U.S., the UK and Canada.
For more information about the Company, please visit www.suncommunities.com.
Company Contacts
| Management | Investor Relations |
| • Gary A. Shiffman, Chairman, President and CEO | Sara Ismail, Vice President |
| • Fernando Castro-Caratini, EVP and CFO | (248) 208-2500 |
- Bruce D. Thelen, EVP and COO investorrelations@suncommunities.com
Corporate Debt Ratings
| Moody’s | S&P | |
| Baa3 | Stable | BBB | Stable | |
| Equity Research Coverage | ||
| Bank of America Merrill Lynch | Joshua Dennerlein | joshua.dennerlein@bofa.com |
| Barclays | Anthony Powell | anthony.powell@barclays.com |
| BMO Capital Markets | John Kim | jp.kim@bmo.com |
| Citi Research | Eric Wolfe | eric.wolfe@citi.com |
| Nicholas Joseph | nicholas.joseph@citi.com | |
| Evercore ISI | Samir Khanal | samir.khanal@evercoreisi.com |
| Steve Sakwa | steve.sakwa@evercoreisi.com | |
| Green Street Advisors | John Pawlowski | jpawlowski@greenstreetadvisors.com |
| JMP Securities | Aaron Hecht | ahecht@jmpsecurities.com |
| RBC Capital Markets | Brad Heffern | brad.heffern@rbccm.com |
| Robert W. Baird & Co. | Wesley Golladay | wgolladay@rwbaird.com |
| Truist Securities | Anthony Hau | anthony.hau@truist.com |
| UBS | Michael Goldsmith | michael.goldsmith@ubs.com |
| Wells Fargo | James Feldman | james.feldman@wellsfargo.com |
| Wolfe Research | Andrew Rosivach | arosivach@wolferesearch.com |
| Keegan Carl | kcarl@wolferesearch.com |
Financial and Operating Highlights
(amounts in millions, except for *)
Quarters Ended
9/30/2023 6/30/2023 3/31/2023 12/31/2022 9/30/2022
| Financial Information | ||||||
| Basic earnings / (loss) per share* | $ | 1.31 | $ 0.72 | $ (0.24) | $ 0.04 | $ 1.32 |
| Diluted earnings / (loss) per share* | $ | 1.31 | $ 0.72 | $ (0.24) | $ 0.04 | $ 1.32 |
| Cash distributions declared per common share* | $ | 0.93 | $ 0.93 | $ 0.93 | $ 0.88 | $ 0.88 |
| FFO per Share(a)* | $ | 2.55 | $ 1.95 | $ 1.14 | $ 1.02 | $ 2.54 |
| Core FFO per Share(a)* | $ | 2.57 | $ 1.96 | $ 1.23 | $ 1.33 | $ 2.65 |
| Real Property NOI | ||||||
| MH | $ | 182.5 | $ 168.7 | $ 156.9 | $ 153.5 | $ 166.8 |
| RV | 128.4 | 76.5 | 45.8 | 46.1 | 127.0 | |
| Marinas | 83.1 | 72.4 | 52.0 | 58.3 | 77.8 | |
| Total | $ | 394.0 | $ 317.6 | $ 254.7 | $ 257.9 | $ 371.6 |
| Recurring EBITDA | $ | 433.0 | $ 339.7 | $ 237.4 | $ 236.3 | $ 408.1 |
| TTM Recurring EBITDA / Interest* | 4.0 x | 4.3 x | 4.6 x | 5.2 x | 5.7 x | |
| Net Debt / TTM Recurring EBITDA | 6.1 x | 6.2 x | 6.1 x | 6.0 x | 5.7 x | |
| Balance Sheet | ||||||
| Total assets | $ 17,605.3 | $ 17,561.4 | $ 17,363.8 | $ 17,084.2 | $ 16,484.6 | |
| Total debt | $ 7,665.0 | $ 7,614.0 | $ 7,462.0 | $ 7,197.2 | $ 6,711.0 | |
| Total liabilities | $ 9,465.0 | $ 9,474.8 | $ 9,294.8 | $ 8,992.8 | $ 8,354.6 | |
| Operating Information* | ||||||
| Properties | ||||||
| MH | 353 | 354 | 354 | 353 | 350 | |
| RV | 182 | 182 | 182 | 182 | 181 | |
| Marina | 135 | 135 | 135 | 134 | 131 | |
| Total | 670 | 671 | 671 | 669 | 662 | |
| Sites, Wet Slips and Dry Storage Spaces* | ||||||
| Manufactured homes | 118,250 | 118,170 | 117,970 | 118,020 | 116,910 | |
| Annual RV | 32,150 | 31,620 | 30,860 | 30,330 | 32,030 | |
| Transient site | 29,770 | 30,270 | 30,870 | 31,180 | 31,150 | |
| Total sites | 180,170 | 180,060 | 179,700 | 179,530 | 180,090 | |
| Marina wet slips and dry storage spaces(b) | 48,030 | 48,180 | 47,990 | 47,820 | 46,190 | |
| Occupancy* | ||||||
| MH occupancy (including UK) | 95.4 % | 95.3 % | 95.1 % | 95.0 % | 95.5 % | |
| Annual RV occupancy | 100.0 % | 100.0 % | 100.0 % | 100.0 % | 100.0 % | |
| Blended MH and annual RV occupancy | 96.4 % | 96.3 % | 96.1 % | 96.0 % | 96.5 % | |
| MH and RV Revenue Producing Site Net Gains(c) (excluding UK Operations)* | ||||||
| MH leased sites, net | 207 | 285 | 278 | 346 | 122 | |
| RV leased sites, net | 537 | 754 | 524 | 267 | 567 | |
| Total leased sites, net | 744 | 1,039 | 802 | 613 | 689 | |
- Excludes the effects of certain anti-dilutive convertible securities.
- Total wet slips and dry storage spaces are adjusted each quarter based on site configuration and usability.
- Revenue producing site net gains do not include occupied sites acquired during the year.
Portfolio Overview as of September 30, 2023
MH & RV Properties
Total MH and Sites for
Location Properties Sites Occupancy % Sites RV Sites Development
| North America | |||||||||||
| Florida | 129 | 40,460 | 97.5 % | 3,950 | 44,410 | 3,400 | |||||
| Michigan | 85 | 32,850 | 96.7 % | 630 | 33,480 | 1,300 | |||||
| California | 37 | 6,920 | 98.8 % | 1,880 | 8,800 | 850 | |||||
| Texas | 31 | 8,950 | 95.2 % | 2,580 | 11,530 | 4,000 | |||||
| Ontario, Canada | 16 | 4,680 | 100.0 % | 500 | 5,180 | 1,450 | |||||
| Connecticut | 16 | 1,930 | 94.8 % | 80 | 2,010 | — | |||||
| Maine | 15 | 2,470 | 95.6 % | 1,070 | 3,540 | 200 | |||||
| Arizona | 13 | 4,570 | 94.4 % | 940 | 5,510 | — | |||||
| Indiana | 12 | 3,160 | 97.2 % | 1,020 | 4,180 | 180 | |||||
| New Jersey | 11 | 3,000 | 100.0 % | 1,050 | 4,050 | 260 | |||||
| Colorado | 11 | 2,810 | 89.1 % | 990 | 3,800 | 1,490 | |||||
| Virginia | 10 | 1,480 | 99.9 % | 1,970 | 3,450 | 750 | |||||
| New York | 10 | 1,520 | 99.1 % | 1,420 | 2,940 | 780 | |||||
| New Hampshire | 10 | 1,740 | 99.9 % | 680 | 2,420 | 80 | |||||
| Other | 74 | 15,810 | 98.5 % | 7,730 | 23,540 | 940 | |||||
| North America Total | 480 | 132,350 | 97.2 % | 26,490 | 158,840 | 15,680 | |||||
| United Kingdom | 55 | 18,050 | 90.6 % | 3,280 | 21,330 | 2,290 | |||||
| Total | 535 | 150,400 | 96.4 % | 29,770 | 180,170 | 17,970 |
Marina
Wet Slips and
Dry Storage
Location Properties Spaces
| Florida | 21 | 5,200 | |||||||
| Rhode Island | 12 | 3,460 | |||||||
| California | 11 | 5,710 | |||||||
| Connecticut | 11 | 3,330 | |||||||
| New York | 9 | 3,020 | |||||||
| Maryland | 9 | 2,480 | |||||||
| Massachusetts | 9 | 2,520 | |||||||
| Other | 53 | 22,310 | |||||||
| Total | 135 | 48,030 |
Sites, Wet Slips and Dry Storage
Properties Spaces
| Total Portfolio | 670 | 228,200 |
Consolidated Balance Sheets
(amounts in millions)
September 30, 2023 December 31, 2022
| Assets | ||||
| Land | $ | 3,996.4 | $ | 4,322.3 |
| Land improvements and buildings | 11,418.4 | 10,903.4 | ||
| Rental homes and improvements | 725.6 | 645.2 | ||
| Furniture, fixtures and equipment | 995.1 | 839.0 | ||
| Investment property | 17,135.5 | 16,709.9 | ||
| Accumulated depreciation | (3,144.8) | (2,738.9) | ||
| Investment property, net | 13,990.7 | 13,971.0 | ||
| Cash, cash equivalents and restricted cash | 62.0 | 90.4 | ||
| Marketable securities | 112.8 | 127.3 | ||
| Inventory of manufactured homes | 219.8 | 202.7 | ||
| Notes and other receivables, net | 832.2 | 617.3 | ||
| Goodwill | 1,084.1 | 1,018.4 | ||
| Other intangible assets, net | 374.7 | 402.0 | ||
| Other assets, net | 929.0 | 655.1 | ||
| Total Assets | $ | 17,605.3 | $ | 17,084.2 |
| Liabilities | ||||
| Secured debt | $ | 3,359.5 | $ | 3,217.8 |
| Unsecured debt | 4,305.5 | 3,979.4 | ||
| Distributions payable | 118.2 | 111.3 | ||
| Advanced reservation deposits and rent | 372.7 | 352.1 | ||
| Accrued expenses and accounts payable | 380.2 | 396.3 | ||
| Other liabilities | 928.9 | 935.9 | ||
| Total Liabilities | 9,465.0 | 8,992.8 | ||
| Commitments and contingencies | ||||
| Temporary equity | 304.5 | 202.9 | ||
| Shareholders’ Equity | ||||
| Common stock | 1.2 | 1.2 | ||
| Additional paid-in capital | 9,581.6 | 9,549.7 | ||
| Accumulated other comprehensive income / (loss) | 5.2 | (9.9) | ||
| Distributions in excess of accumulated earnings | (1,848.2) | (1,731.2) | ||
| Total SUI shareholders’ equity | 7,739.8 | 7,809.8 | ||
| Noncontrolling interests | ||||
| Common and preferred OP units | 96.0 | 78.7 | ||
| Total noncontrolling interests | 96.0 | 78.7 | ||
| Total Shareholders’ Equity | 7,835.8 | 7,888.5 | ||
| Total Liabilities, Temporary Equity and Shareholders’ Equity | $ | 17,605.3 | $ | 17,084.2 |
Consolidated Statements of Operations
(amounts in millions, except for per share amounts)
Quarter Ended
September 30, September 30, % September 30, %
2023 2022 Change 2023 2022 Change
| Revenues | ||||||||||
| Real property (excluding transient) | $ | 457.2 | $ | 425.3 | 7.5 % | $ | 1,285.5 | $ | 1,158.1 | 11.0 % |
| Real property – transient | 161.6 | 160.4 | 0.7 % | 300.9 | 303.5 | (0.9) % | ||||
| Home sales | 117.8 | 150.7 | (21.8) % | 326.7 | 358.1 | (8.8) % | ||||
| Service, retail, dining and entertainment | 205.4 | 174.2 | 17.9 % | 498.9 | 423.0 | 17.9 % | ||||
| Interest | 15.2 | 11.2 | 35.7 % | 40.6 | 25.3 | 60.5 % | ||||
| Brokerage commissions and other, net | 26.0 | 10.8 | 140.7 % | 45.3 | 27.4 | 65.3 % | ||||
| Total Revenues | 983.2 | 932.6 | 5.4 % | 2,497.9 | 2,295.4 | 8.8 % | ||||
| Expenses | ||||||||||
| Property operating and maintenance | 195.5 | 184.7 | 5.8 % | 530.7 | 469.2 | 13.1 % | ||||
| Real estate tax | 29.3 | 29.4 | (0.3) % | 89.4 | 83.2 | 7.5 % | ||||
| Home costs and selling | 80.5 | 96.4 | (16.5) % | 224.9 | 235.2 | (4.4) % | ||||
| Service, retail, dining and entertainment | 178.7 | 144.9 | 23.3 % | 450.4 | 363.3 | 24.0 % | ||||
| General and administrative | 66.2 | 69.1 | (4.2) % | 192.4 | 187.0 | 2.9 % | ||||
| Catastrophic event-related charges, net | (3.1) | 12.2 | (125.4) % | (2.2) | 12.3 | (117.9) % | ||||
| Business combinations | — | 8.4 | (100.0) % | 3.0 | 23.9 | (87.4) % | ||||
| Depreciation and amortization | 162.6 | 149.7 | 8.6 % | 482.3 | 447.7 | 7.7 % | ||||
| Asset impairments | 1.2 | 1.6 | (25.0) % | 10.1 | 2.3 | N/M | ||||
| Loss on extinguishment of debt | — | 4.0 | (100.0) % | — | 4.4 | (100.0) % | ||||
| Interest | 84.1 | 61.7 | 36.3 % | 239.9 | 162.2 | 47.9 % | ||||
| Interest on mandatorily redeemable preferred OP units / equity | 0.8 | 1.0 | (20.0) % | 2.7 | 3.1 | (12.9) % | ||||
| Total Expenses | 795.8 | 763.1 | 4.3 % | 2,223.6 | 1,993.8 | 11.5 % | ||||
| Income Before Other Items | 187.4 | 169.5 | 10.6 % | 274.3 | 301.6 | (9.1) % | ||||
| Gain / (loss) on remeasurement of marketable securities | 6.1 | (7.2) | N/M | (8.0) | (74.0) | (89.2) % | ||||
| Gain / (loss) on foreign currency exchanges | (6.5) | 14.9 | N/M | (6.5) | 21.7 | N/M | ||||
| Gain / (loss) on dispositions of properties | (0.7) | (0.8) | (12.5) % | (2.9) | 12.5 | N/M | ||||
| Other income / (expense), net(a) | (3.7) | 2.8 | N/M | (5.5) | 2.6 | N/M | ||||
| Gain / (loss) on remeasurement of notes receivable | (1.3) | (0.1) | N/M | (3.1) | 0.1 | N/M | ||||
| Income from nonconsolidated affiliates | 1.4 | 2.0 | (30.0) % | 0.5 | 3.8 | (86.8) % | ||||
| Gain / (loss) on remeasurement of investment in nonconsolidated affiliates | — | (0.4) (100.0) % | (4.5) | 0.1 | N/M | |||||
| Current tax expense | (4.6) | (7.3) (37.0) % | (13.9) | (12.5) | 11.2 % | |||||
| Deferred tax benefit | 2.3 | 3.6 (36.1) % | 14.6 | 3.9 | 274.4 % | |||||
| Net Income | 180.4 | 177.0 1.9 % | 245.0 | 259.8 | (5.7) % | |||||
| Less: Preferred return to preferred OP units / equity interests | 3.3 | 2.5 32.0 % | 9.0 | 8.6 | 4.7 % | |||||
| Less: Income attributable to noncontrolling interests | 14.0 | 11.9 17.6 % | 13.2 | 13.9 | (5.0) % | |||||
| Net Income Attributable to SUI Common Shareholders | $ | 163.1 | $ | 162.6 0.3 % | $ | 222.8 | $ | 237.3 | (6.1) % | |
| Weighted average common shares outstanding – basic(a) | 123.5 | 122.4 0.9 % | 123.4 | 119.2 | 3.5 % | |||||
| Weighted average common shares outstanding – diluted(a) | 123.5 | 122.8 0.6 % | 123.4 | 121.9 | 1.2 % | |||||
| Basic earnings per share | $ | 1.31 | $ | 1.32 (0.8) % | $ | 1.79 | $ | 1.98 | (9.6) % | |
| Diluted earnings per share(b) | $ | 1.31 | $ | 1.32 (0.8) % | $ | 1.79 | $ | 1.97 | (9.1) % | |
- Refer to Definitions and Notes for additional information.
- Excludes the effect of certain anti-dilutive convertible securities.N/M = Percentage change is not meaningful.
Reconciliation of Net Income Attributable to SUI Common Shareholders to Core FFO
(amounts in millions, except for per share data)
September 30, September 30, September 30, September 30,
2023 2022 2023 2022
| Net Income Attributable to SUI Common Shareholders | $ | 163.1 | $ | 162.6 | $ | 222.8 | $ | 237.3 | |
| Adjustments | |||||||||
| Depreciation and amortization | 162.2 | 149.2 | 480.5 | 446.3 | |||||
| Depreciation on nonconsolidated affiliates | 0.1 | — | 0.2 | 0.1 | |||||
| Asset impairments | 1.2 | 1.6 | 10.1 | 2.3 | |||||
| (Gain) / loss on remeasurement of marketable securities | (6.1) | 7.2 | 8.0 | 74.0 | |||||
| (Gain) / loss on remeasurement of investment in nonconsolidated affiliates | — | 0.4 | 4.5 | (0.1) | |||||
| (Gain) / loss on remeasurement of notes receivable | 1.3 | 0.1 | 3.1 | (0.1) | |||||
| (Gain) / loss on dispositions of properties, including tax effect | 0.7 | 0.8 | 5.0 | (12.5) | |||||
| Add: Returns on preferred OP units | 1.8 | 1.3 | 6.2 | 9.5 | |||||
| Add: Income attributable to noncontrolling interests | 12.6 | 10.5 | 11.9 | 14.1 | |||||
| Gain on dispositions of assets, net | (10.5) | (11.9) | (29.0) | (44.2) | |||||
| FFO(a) | $ | 326.4 | $ | 321.8 | $ | 723.3 | $ | 726.7 | |
| Adjustments | |||||||||
| Business combination expense and other acquisition related costs(a) | 4.2 | 19.2 | 15.6 | 40.1 | |||||
| Loss on extinguishment of debt | — | 4.0 | — | 4.4 | |||||
| Catastrophic event-related charges, net | (3.1) | 12.2 | (2.2) | 12.3 | |||||
| Loss of earnings – catastrophic event-related charges, net(b) | (6.1) | 0.2 | 4.9 | 0.2 | |||||
| (Gain) / loss on foreign currency exchanges | 6.5 | (14.9) | 6.5 | (21.7) | |||||
| Other adjustments, net(a) | 1.1 | (6.5) | (9.6) | (5.1) | |||||
| Core FFO(a)(c) | $ | 329.0 | $ | 336.0 | $ | 738.5 | $ | 756.9 | |
| Weighted Average Common Shares Outstanding – Diluted | 128.0 | 126.7 | 128.3 | 125.4 | |||||
| FFO per Share(c) | $ | 2.55 | $ | 2.54 | $ | 5.64 | $ | 5.80 | |
| Core FFO per Share(c) | $ | 2.57 | $ | 2.65 | $ | 5.76 | $ | 6.04 |
- Refer to Definitions and Notes for additional information.
- Loss of earnings – catastrophic event-related charges, net include the following:
Quarter Ended Nine Months Ended
September 30, 2023 September 30, 2023
| Hurricane Ian – Three Fort Myers, Florida RV communities impaired | |||
| Estimated loss of earnings in excess of the applicable business interruption deductible | $ | 6.3 $ | 16.8 |
| Insurance recoveries received for previously estimated loss of earnings through April 30, 2023 | (11.8) | (11.8) | |
| Hurricane Irma – Three Florida Keys communities impaired | |||
| Estimated loss of earnings in excess of the applicable business interruption deductible | — | 0.5 | |
| Reversal of unpaid previously estimated loss of earnings that the Company does not expect to recover | (0.6) | (0.6) | |
| Loss of earnings – catastrophic event-related charges, net | $ | (6.1) $ | 4.9 |
- Excludes the effect of certain anti-dilutive convertible securities.
Refer to Definitions and Notes for additional information for Home sales contribution to FFO.
Reconciliation of Net Income Attributable to SUI Common Shareholders to NOI
(amounts in millions)
September 30, September 30, September 30, September 30,
2023 2022 2023 2022
| Net Income Attributable to SUI Common Shareholders | $ | 163.1 | $ | 162.6 | $ | 222.8 | $ | 237.3 | |
| Interest income | (15.2) | (11.2) | (40.6) | (25.3) | |||||
| Brokerage commissions and other revenues, net | (26.0) | (10.8) | (45.3) | (27.4) | |||||
| General and administrative | 66.2 | 69.1 | 192.4 | 187.0 | |||||
| Catastrophic event-related charges, net | (3.1) | 12.2 | (2.2) | 12.3 | |||||
| Business combination expense | — | 8.4 | 3.0 | 23.9 | |||||
| Depreciation and amortization | 162.6 | 149.7 | 482.3 | 447.7 | |||||
| Asset impairments | 1.2 | 1.6 | 10.1 | 2.3 | |||||
| Loss on extinguishment of debt | — | 4.0 | — | 4.4 | |||||
| Interest expense | 84.1 | 61.7 | 239.9 | 162.2 | |||||
| Interest on mandatorily redeemable preferred OP units / equity | 0.8 | 1.0 | 2.7 | 3.1 | |||||
| (Gain) / loss on remeasurement of marketable securities | (6.1) | 7.2 | 8.0 | 74.0 | |||||
| (Gain) / loss on foreign currency exchanges | 6.5 | (14.9) | 6.5 | (21.7) | |||||
| (Gain) / loss on disposition of properties | 0.7 | 0.8 | 2.9 | (12.5) | |||||
| Other (income) / expense, net(a) | 3.7 | (2.8) | 5.5 | (2.6) | |||||
| (Gain) / loss on remeasurement of notes receivable | 1.3 | 0.1 | 3.1 | (0.1) | |||||
| Income from nonconsolidated affiliates | (1.4) | (2.0) | (0.5) | (3.8) | |||||
| (Gain) / loss on remeasurement of investment in nonconsolidated affiliates | — | 0.4 | 4.5 | (0.1) | |||||
| Current tax expense | 4.6 | 7.3 | 13.9 | 12.5 | |||||
| Deferred tax benefit | (2.3) | (3.6) | (14.6) | (3.9) | |||||
| Add: Preferred return to preferred OP units / equity interests | 3.3 | 2.5 | 9.0 | 8.6 | |||||
| Add: Income attributable to noncontrolling interests | 14.0 | 11.9 | 13.2 | 13.9 | |||||
| NOI | $ | 458.0 | $ | 455.2 | $ | 1,116.6 | $ | 1,091.8 |
Quarter Ended Nine Months Ended
September 30, September 30, September 30, September 30,
2023 2022 2023 2022
| Real Property NOI(a) | $ | 394.0 | $ | 371.6 | $ | 966.3 | $ | 909.2 |
| Home Sales NOI(a) | 37.3 | 54.3 | 101.8 | 122.9 | ||||
| Service, retail, dining and entertainment NOI(a) | 26.7 | 29.3 | 48.5 | 59.7 | ||||
| NOI | $ | 458.0 | $ | 455.2 | $ | 1,116.6 | $ | 1,091.8 |
(a) Refer to Definitions and Notes for additional information.
Reconciliation of Net Income Attributable to SUI Common Shareholders to Recurring EBITDA
(amounts in millions)
September 30, September 30, September 30, September 30,
2023 2022 2023 2022
| Net Income Attributable to SUI Common Shareholders | $ | 163.1 | $ | 162.6 | $ | 222.8 | $ | 237.3 |
| Adjustments | ||||||||
| Depreciation and amortization | 162.6 | 149.7 | 482.3 | 447.7 | ||||
| Asset impairments | 1.2 | 1.6 | 10.1 | 2.3 | ||||
| Loss on extinguishment of debt | — | 4.0 | — | 4.4 | ||||
| Interest expense | 84.1 | 61.7 | 239.9 | 162.2 | ||||
| Interest on mandatorily redeemable preferred OP units / equity | 0.8 | 1.0 | 2.7 | 3.1 | ||||
| Current tax expense | 4.6 | 7.3 | 13.9 | 12.5 | ||||
| Deferred tax benefit | (2.3) | (3.6) | (14.6) | (3.9) | ||||
| Income from nonconsolidated affiliates | (1.4) | (2.0) | (0.5) | (3.8) | ||||
| Less: (Gain) / loss on dispositions of properties | 0.7 | 0.8 | 2.9 | (12.5) | ||||
| Less: Gain on dispositions of assets, net | (10.5) | (11.9) | (29.0) | (44.2) | ||||
| EBITDAre | $ | 402.9 | $ | 371.2 | $ | 930.5 | $ | 805.1 |
| Adjustments | ||||||||
| Catastrophic event-related charges, net | (3.1) | 12.2 | (2.2) | 12.3 | ||||
| Business combination expense | — | 8.4 | 3.0 | 23.9 | ||||
| (Gain) / loss on remeasurement of marketable securities | (6.1) | 7.2 | 8.0 | 74.0 | ||||
| (Gain) / loss on foreign currency exchanges | 6.5 | (14.9) | 6.5 | (21.7) | ||||
| Other (income) / expense, net(a) | 3.7 | (2.8) | 5.5 | (2.6) | ||||
| (Gain) / loss on remeasurement of notes receivable | 1.3 | 0.1 | 3.1 | (0.1) | ||||
| (Gain) / loss on remeasurement of investment in nonconsolidated affiliates | — | 0.4 | 4.5 | (0.1) | ||||
| Add: Preferred return to preferred OP units / equity interests | 3.3 | 2.5 | 9.0 | 8.6 | ||||
| Add: Income attributable to noncontrolling interests | 14.0 | 11.9 | 13.2 | 13.9 | ||||
| Add: Gain on dispositions of assets, net | 10.5 | 11.9 | 29.0 | 44.2 | ||||
| Recurring EBITDA | $ | 433.0 | $ | 408.1 | $ | 1,010.1 | $ | 957.5 |
(a) Refer to Definitions and Notes for additional information.
Supplemental Disclosure
Real Property Operations – Total Portfolio
(amounts in millions, except statistical information)
North North
Financial Information America UK Total RV Marinas Total America UK Total RV Marinas Total
| Revenues | ||||||||||||||||||||||
| Real property (excluding transient) | $ | 229.4 | $ | 29.3 | $ | 258.7 | $ | 82.5 | $ | 116.0 | $ | 457.2 | $ | 213.5 | $ | 24.7 | $ 238.2 | $ 78.4 | $ | 108.7 | $ | 425.3 |
| Real property – transient | 0.8 | 23.0 | 23.8 | 128.0 | 9.8 | 161.6 | 0.3 | 21.8 | 22.1 | 131.2 | 7.1 | 160.4 | ||||||||||
| Total operating revenues | 230.2 | 52.3 | 282.5 | 210.5 | 125.8 | 618.8 | 213.8 | 46.5 | 260.3 | 209.6 | 115.8 | 585.7 | ||||||||||
| Expenses | ||||||||||||||||||||||
| Property operating expenses | 76.7 | 23.3 | 100.0 | 82.1 | 42.7 | 224.8 | 72.2 | 21.3 | 93.5 | 82.6 | 38.0 | 214.1 | ||||||||||
| Real Property NOI | $ | 153.5 | $ | 29.0 | $ | 182.5 | $ | 128.4 | $ | 83.1 | $ | 394.0 | $ | 141.6 | $ | 25.2 | $ 166.8 | $ 127.0 | $ | 77.8 | $ | 371.6 |
Nine Months Ended September 30, 2023 Nine Months Ended September 30, 2022
North North
Financial Information America UK Total RV Marinas Total America UK(a) Total RV Marinas Total
| Revenues | ||||||||||||||||||||
| Real property (excluding transient) | $ | 676.9 | $ | 85.1 | $ | 762.0 | $ | 217.1 | $ | 306.4 | $ 1,285.5 | $ | 630.8 | $ | 44.7 | $ 675.5 | $ 208.2 | $ | 274.4 | $ 1,158.1 |
| Real property – transient | 1.5 | 37.9 | 39.4 | 241.3 | 20.2 | 300.9 | 1.2 | 34.7 | 35.9 | 253.0 | 14.6 | 303.5 | ||||||||
| Total operating revenues | 678.4 | 123.0 | 801.4 | 458.4 | 326.6 | 1,586.4 | 632.0 | 79.4 | 711.4 | 461.2 | 289.0 | 1,461.6 | ||||||||
| Expenses | ||||||||||||||||||||
| Property operating expenses | 223.1 | 70.3 | 293.4 | 207.6 | 119.1 | 620.1 | 204.1 | 38.8 | 242.9 | 205.3 | 104.2 | 552.4 | ||||||||
| Real Property NOI | $ | 455.3 | $ | 52.7 | $ | 508.0 | $ | 250.8 | $ | 207.5 | $ 966.3 | $ | 427.9 | $ | 40.6 | $ 468.5 | $ 255.9 | $ | 184.8 | $ 909.2 |
As of September 30, 2023 As of September 30, 2022
North North
Other information America UK Total RV Marinas Total America UK(a) Total RV Marinas Total
| Number of properties | 298 | 55 | 353 | 182 | 135 | 670 | 296 | 54 | 350 | 181 | 131 | 662 | |||||||
| Sites, wet slips and dry storage spaces | |||||||||||||||||||
| Sites, wet slips and dry storage spaces(b) | 100,200 | 18,050 | 118,250 | 32,150 | 48,030 | 198,430 | 99,430 | 17,480 | 116,910 | 32,030 | 46,190 | 195,130 | |||||||
| Transient sites | N/M | 3,280 | 3,280 | 26,490 | N/A | 29,770 | N/M | 3,200 | 3,200 | 27,950 | N/A | 31,150 | |||||||
| Total | 100,200 | 21,330 | 121,530 | 58,640 | 48,030 | 228,200 | 99,430 | 20,680 | 120,110 | 59,980 | 46,190 | 226,280 | |||||||
| MH and Annual RV Occupancy | 96.3 % | 90.6 % | 95.4 % | 100.0 % | N/A | 96.4 % | 96.2 % | 91.7 % | 95.5 % | 100.0 % | N/A | 96.5 % |
N/M = Not meaningful. N/A = Not applicable.
- UK amounts for the nine months ended September 30, 2022 cover April 8, 2022 (date of acquisition) to September 30, 2022.
- MH annual sites included 9,834 and 9,126 rental homes in the Company’s Rental Program during the quarter ended September 30, 2023 and 2022, respectively. The Company’s investment in occupied rental homes at September 30, 2023 was $655.8 million, an increase of 20.6% from $543.8 million at September 30, 2022.
Real Property Operations – Same Property Portfolio(a)
(amounts in millions, except for statistical information)
Total
MH(b) RV(b) Marina Total MH(b) RV(b) Marina Total Change MH RV Marina Total
| Financial Information | ||||||||||||||||||||||
| Same Property Revenues | ||||||||||||||||||||||
| Real property (excluding transient) | $ | 209.2 | $ | 74.4 | $ | 91.0 | $ | 374.6 | $ | 195.0 | $ | 64.7 | $ | 85.8 | $ | 345.5 | $ | 29.1 | 7.3 % | 15.0 % | 6.0 % | 8.4 % |
| Real property – transient | 0.4 | 118.4 | 7.9 | 126.7 | 0.2 | 123.9 | 5.4 | 129.5 | (2.8) | 72.6 % | (4.4) % | 47.1 % | (2.1) % | |||||||||
| Total Same Property operating revenues | 209.6 | 192.8 | 98.9 | 501.3 | 195.2 | 188.6 | 91.2 | 475.0 | 26.3 | 7.4 % | 2.2 % | 8.4 % | 5.5 % | |||||||||
| Same Property Expenses | ||||||||||||||||||||||
| Same Property operating expenses(d)(e) | 57.1 | 69.3 | 29.7 | 156.1 | 54.1 | 69.8 | 27.7 | 151.6 | 4.5 | 5.7 % | (0.8) % | 7.4 % | 3.0 % | |||||||||
| Real Property NOI(e) | $ | 152.5 | $ | 123.5 | $ | 69.2 | $ | 345.2 | $ | 141.1 | $ | 118.8 | $ | 63.5 | $ | 323.4 | $ | 21.8 | 8.0 % | 4.1 % | 8.9 % | 6.7 % |
Nine Months Ended September 30, 2023 Nine Months Ended September 30, 2022 Total % Change(c)
MH(b) RV(b) Marina Total MH(b) RV(b) Marina Total Change MH RV Marina Total
| Financial Information | ||||||||||||||||||||
| Same Property Revenues | ||||||||||||||||||||
| Real property (excluding transient) | $ | 619.5 | $ | 198.7 | $ | 244.5 | $ 1,062.7 | $ | 579.9 | $ | 171.9 | $ | 227.1 | $ 978.9 | $ | 83.8 | 6.8 % | 15.6 % | 7.7 % | 8.6 % |
| Real property – transient | 1.0 | 224.4 | 17.5 | 242.9 | 0.9 | 236.7 | 12.5 | 250.1 | (7.2) | 11.8 % | (5.2) % | 39.5 % | (2.9) % | |||||||
| Total Same Property operating revenues | 620.5 | 423.1 | 262.0 | 1,305.6 | 580.8 | 408.6 | 239.6 | 1,229.0 | 76.6 | 6.8 % | 3.6 % | 9.4 % | 6.2 % | |||||||
| Same Property Expenses | ||||||||||||||||||||
| Same Property operating expenses(d)(e) | 167.0 | 178.4 | 84.1 | 429.5 | 154.0 | 172.9 | 80.1 | 407.0 | 22.5 | 8.5 % | 3.1 % | 5.1 % | 5.5 % | |||||||
| Real Property NOI(e) | $ | 453.5 | $ | 244.7 | $ | 177.9 | $ 876.1 | $ | 426.8 | $ | 235.7 | $ | 159.5 | $ 822.0 | $ | 54.1 | 6.2 % | 3.9 % | 11.5 % | 6.6 % |
| Other Information | ||||||||||||||||||||
| Number of properties | 288 | 161 | 119 | 568 | 288 | 161 | 119 | 568 | ||||||||||||
| Sites, wet slips and dry storage spaces | 98,590 | 54,630 | 40,890 | 194,110 | 97,830 | 54,340 | 40,690 | 192,860 |
- Refer to the Definitions and Notes for additional information.
- Same Property results for the Company’s MH and RV properties reflect constant currency for comparative purposes. Canadian currency figures in the prior comparative period have been translated at the average exchange rate of $0.7453 USD and $0.7431 USD per Canadian dollar during the quarter and nine months ended September 30, 2023, respectively.
- Percentages are calculated based on unrounded numbers.
Real Property Operations – Same Property Portfolio(a) (Continued)
(amounts in millions, except for statistical information)
- The Company nets certain utility revenues (which include utility reimbursement revenues from residents) against related utility expenses in property operating expenses as follows (in millions):
Quarter Ended September 30, 2023 Quarter Ended September 30, 2022
| MH RV Marina Total | MH RV Marina Total | |||
| Utility revenue netted against related utility expense | $ | 18.2 $ 6.3 $ 5.9 $ 30.4 | $ | 17.2 $ 5.8 $ 5.2 $ 28.2 |
| Nine Months Ended September 30, 2023
MH RV Marina Total |
Nine Months Ended September 30, 2022 | |||
| MH RV Marina Total | ||||
| Utility revenue netted against related utility expense | $ | 52.1 $ 15.3 $ 16.7 $ 84.1 | $ | 48.2 $ 14.3 $ 14.1 $ 76.6 |
- Total Same Property operating expenses consist of the following components for the periods shown (in millions) and exclude amounts invested into recently acquired properties to bring them up to the Company’s standards:
Quarter Ended Nine Months Ended
September 30, September 30, September 30, September 30,
2023 2022 Change % Change 2023 2022 Change % Change
| Payroll and benefits | $ | 54.8 | $ | 51.6 | $ | 3.2 | 6.2 % | $ | 146.2 | $ | 139.5 | $ | 6.7 | 4.8 % | |
| Real estate taxes | 26.4 | 25.9 | 0.5 | 2.1 % | 81.2 | 77.7 | 3.5 | 4.6 % | |||||||
| Supplies and repairs | 22.9 | 24.4 | (1.5) | (6.2) % | 58.0 | 58.4 | (0.4) | (0.7) % | |||||||
| Utilities | 18.9 | 19.8 | (0.9) | (4.2) % | 49.5 | 50.3 | (0.8) | (1.6) % | |||||||
| Legal, state / local taxes, and insurance | 14.0 | 9.5 | 4.5 | 47.7 % | 42.0 | 28.3 | 13.7 | 48.2 % | |||||||
| Other | 19.1 | 20.4 | (1.3) | (6.7) % | 52.6 | 52.8 | (0.2) | (0.4) % | |||||||
| Total Same Property Operating Expenses | $ | 156.1 | $ | 151.6 | $ | 4.5 | 3.0 % | $ | 429.5 | $ | 407.0 | $ | 22.5 | 5.5 % |
Real Property Operations – Same Property Portfolio(a) (Continued)
As of
September 30, 2023 September 30, 2022
MH RV MH RV
| Other Information | |||||||||
| Number of properties | 288 | 161 | 288 | 161 | |||||
| Sites | |||||||||
| MH and Annual RV sites | 98,590 | 31,850 | 97,830 | 29,790 | |||||
| Transient RV sites | N/M | 22,780 | N/M | 24,550 | |||||
| Total | 98,590 | 54,630 | 97,830 | 54,340 | |||||
| MH and Annual RV Occupancy | |||||||||
| Occupancy(b) | 97.0 % | 100.0 % | 96.8 % | 100.0 % | |||||
| Monthly base rent per site | $ | 661 | $ | 580 | $ | 623 | $ | 533 | |
| % Change of monthly base rent(c) | 6.1 % | 8.8 % | N/A | N/A | |||||
| Rental Program Statistics included in MH: | |||||||||
| Number of occupied sites, end of period(d) | 9,680 | N/A | 9,110 | N/A | |||||
| Monthly rent per site – MH Rental Program | $ | 1,282 | N/A | $ | 1,193 | N/A | |||
| % Change(d) | 7.5 % | N/A | N/A | N/A |
N/M = Not meaningful. N/A = Not applicable.
- Refer to Definitions and Notes for additional information.
- Same Property adjusted blended occupancy for MH and RV combined increased to 98.8% at September 30, 2023, from 97.1% at September 30, 2022. The 170 basis point increase was driven by MH expansion fills and the conversion of transient RV sites to annual sites.
- Calculated using actual results without rounding.
- Occupied rental program sites in Same Property are included in total sites.
Other Operating Information
Home Sales Summary
(amounts in millions, except for *)
Quarter Ended Nine Months Ended
September 30, September 30, % September 30, September 30, %
Financial Information 2023 2022 Change 2023 2022 Change
| North America | ||||||||||
| Home sales | $ | 62.4 | $ | 66.6 | (6.3) % | $ | 171.9 | $ | 213.4 | (19.4) % |
| Home cost and selling expenses | 48.0 | 51.5 | (6.8) % | 130.2 | 155.9 | (16.5) % | ||||
| NOI | $ | 14.4 | $ | 15.1 | (4.6) % | $ | 41.7 | $ | 57.5 | (27.5) % |
| NOI margin %* | 23.1 % | 22.7 % | 24.3 % | 26.9 % | ||||||
| UK(a) | ||||||||||
| Home sales | $ | 55.4 | $ | 84.1 | (34.1) % | $ | 154.8 | $ | 144.7 | 7.0 % |
| Home cost and selling expenses | 32.5 | 44.9 | (27.6) % | 94.7 | 79.3 | 19.4 % | ||||
| NOI | $ | 22.9 | $ | 39.2 | (41.6) % | $ | 60.1 | $ | 65.4 | (8.1) % |
| NOI margin %* | 41.3 % | 46.6 % | 38.8 % | 45.2 % | ||||||
| Total(a) | ||||||||||
| Home sales | $ | 117.8 | $ | 150.7 | (21.8) % | $ | 326.7 | $ | 358.1 | (8.8) % |
| Home cost and selling expenses | 80.5 | 96.4 | (16.5) % | 224.9 | 235.2 | (4.4) % | ||||
| NOI | $ | 37.3 | $ | 54.3 | (31.3) % | $ | 101.8 | $ | 122.9 | (17.2) % |
| NOI margin %* | 31.7 % | 36.0 % | 31.2 % | 34.3 % | ||||||
| Other information | ||||||||||
| Units Sold:* | ||||||||||
| North America | 636 | 724 | (12.2) % | 1,909 | 2,538 | (24.8) % | ||||
| UK(a) | 884 | 1,016 | (13.0) % | 2,310 | 1,778 | 29.9 % | ||||
| Total home sales(a) | 1,520 | 1,740 | (12.6) % | 4,219 | 4,316 | (2.2) % | ||||
| Average Selling Price:* | ||||||||||
| North America | $ | 98,113 | $ | 91,989 | 6.7 % | $ | 90,047 | $ | 84,082 | 7.1 % |
| UK(a) | $ | 62,670 | $ | 82,776 | (24.3) % | $ | 67,013 | $ | 81,384 | (17.7) % |
(a) UK amounts for the nine months ended September 30, 2022 cover the period from April 8, 2022 (date of acquisition) through September 30, 2022.
Operating Statistics for MH and Annual RVs (excluding UK Operations)
Leased Sites, New Home Pre-owned Brokered % of Total Sites Number of Move-outs Net(b) Sales Home Sales Re-sales
| 2023 – YTD as of September 30 | 3.7 % (a) | 5,651 | 2,585 | 421 | 1,488 | 1,818 | |||||
| 2022 | 3.0 % | 5,170 | 2,922 | 703 | 2,509 | 2,864 | |||||
| 2021 | 2.7 % | 5,276 | 2,483 | 732 | 3,356 | 3,528 |
- Percentage calculated on a trailing 12-month basis.
- Net increase in revenue producing sites.
Investment Activity
Acquisitions and Dispositions
(amounts in millions, except for *)
Sites, Wet Slips Expansion or State, Total
Property Number of and Dry Storage Development Province Purchase / Month
Property Name Type Properties* Spaces* Sites* or Country Sale Price Acquired
| ACQUISITIONS | ||||||||||||
| Fox Run(a) | MH | 1 | 68 | 72 | MI | $ | 7.0 | January | ||||
| Savannah Yacht Center(b) | Marina | 1 | 24 | — | GA | 100.0 | March | |||||
| First Quarter 2023 | 2 | 92 | 72 | $ | 107.0 | |||||||
| Acquisitions in 2023 | 2 | 92 | 72 | $ | 107.0 | |||||||
| DISPOSITIONS | ||||||||||||
| Cedar Haven | MH | 1 | 155 | — | ME | $ | 6.8 | August | ||||
| Third Quarter 2023 | 1 | 155 | — | $ | 6.8 | |||||||
| Dispositions in 2023 | 1 | 155 | — | $ | 6.8 |
- In conjunction with the acquisition of this ground-up development project, the Company issued 31,289 Common OP units valued at $4.4 million. The Company also delivered 68 of the 140 sites during the first quarter.
- In conjunction with this acquisition, the Company issued one million Series K preferred OP units to cover the total purchase price of $100.0 million.
Investment Activity
Capital Expenditures and Investments
(amounts in millions, except for *)
Nine Months Ended Year Ended
September 30, 2023 December 31, 2022 December 31, 2021
MH / RV Marina MH / RV Marina MH / RV Marina
| Recurring Capital Expenditures(a) | $ | 36.1 | $ | 24.9 | $ | 51.0 | $ | 22.8 | $ | 45.3 | $ | 19.3 |
| Non-Recurring Capital Expenditures(a) | ||||||||||||
| Lot Modifications | $ | 41.3 | N/A | $ | 39.1 | N/A | $ | 28.8 | N/A | |||
| Growth Projects | 20.5 | 61.0 | 28.4 | 71.1 | 25.6 | 51.4 | ||||||
| Rebranding | 3.9 | N/A | 15.0 | N/A | 6.1 | N/A | ||||||
| Acquisitions | 147.2 | 172.1 | 2,788.1 | 522.5 | 944.3 | 852.9 | ||||||
| Expansion and Development | 207.1 | 24.9 | 247.9 | 13.9 | 191.8 | 9.9 | ||||||
| Total Non-Recurring Capital Expenditures | 420.0 | 258.0 | 3,118.5 | 607.5 | 1,196.6 | 914.2 | ||||||
| Total | $ | 456.1 | $ | 282.9 | $ | 3,169.5 | $ | 630.3 | $ | 1,241.9 | $ | 933.5 |
| Other Information | ||||||||||||
| Recurring Capex per Site, Slip and Dry Storage Spaces(b)* | $ | 270 | $ | 608 | $ | 397 | $ | 582 | $ | 371 | $ | 491 |
- Refer to Definitions and Notes for additional information.
- Average based on actual number of MH and RV sites and Marina wet slips and dry storage spaces associated with the recurring capital expenditures in each period.
Capitalization Overview
(Shares and units in thousands, dollar amounts in millions, except for *)
(a) Refer to “Securities” within Definitions and Notes for additional information related to our securities outstanding. (b) Refer to “Enterprise Value” and “Net Debt” within Definitions and Notes for additional information.
Summary of Outstanding Debt
(amounts in millions, except for *)
Quarter Ended
September 30, 2023
Weighted Average
Debt Outstanding Interest Rate(a)* Maturity Date*
| Secured Debt | $ | 3,359.5 | 3.81 % | Various |
| Unsecured Debt: | ||||
| Senior Credit Facility: | ||||
| Revolving credit facilities (in USD)(b) | 1,009.3 | 5.98 % | April 2026 | |
| GBP term loan (in USD)(c) | 1,066.4 | 4.83 % | April 2025 | |
| Total senior credit facility | 2,075.7 | |||
| Other unsecured term loan | 9.2 | 6.36 % | October 2025 | |
| Senior credit facility and other term loan | 2,084.9 | 5.39 % | ||
| Senior Unsecured Notes: | ||||
| 2028 senior unsecured notes | 446.7 | 2.30 % | November 2028 | |
| 2031 senior unsecured notes | 742.2 | 2.70 % | July 2031 | |
| 2032 senior unsecured notes | 592.4 | 3.62 % | April 2032 | |
| 2033 senior unsecured notes | 395.6 | 5.51 % | January 2033 | |
| Total Senior Unsecured Notes | 2,176.9 | 3.38 % | ||
| Mandatorily redeemable preferred equity and OP units(d) | 43.7 | 6.10 % | Various | |
| Total Unsecured Debt | 4,305.5 | 4.38 % | ||
| Total debt, per consolidated balance sheets | 7,665.0 | 4.13 % | ||
| Plus: Unamortized deferred financing costs and discounts / premiums on debt(a) | 40.1 | |||
| Total debt | $ | 7,705.1 |
- Includes the effect of amortizing deferred financing costs, loan premiums / discounts and derivatives.
- As of September 30, 2023, the Company’s revolving credit facilities consisted of:
- $464.0 million borrowed on its U.S. line of credit at the Secured Overnight Financing Rate (“SOFR”) plus 85 basis points, of which $125.0 million was swapped to a weighted average fixed SOFR rate of 4.771% for an all-in fixed rate of 5.681%.
- $473.8 million USD equivalent borrowed on its GBP line of credit at the Daily Sterling Overnight Index Average (“SONIA”) plus 85 basis points.
- $71.5 million USD equivalent borrowed on its Australian line of credit at the Bank Bill Swap Bid Rate (“BBSY”) plus 85 basis points.
- As of September 30, 2023, £500.0 million ($610.1 million) was swapped to a weighted average fixed SONIA rate of 2.924% for an all-in fixed rate, inclusive of spread, of 3.866%.
- Mandatorily redeemable preferred equity and OP unit distributions are included within the line item ‘Interest on mandatorily redeemable preferred OP units / equity’ on the Company’s Consolidated Statements of Operations.
Debt Maturities(e)
Principal Senior Senior Other
Year Secured Debt(f) Amortization Credit Facility Unsecured Notes Unsecured Debt Total
| 2023 | $ | 117.8 (g) | $ | 13.8 | $ | — | $ | — | $ | — | $ | 131.6 |
| 2024 | 128.8 | 56.5 | — | — | 51.1 | 236.4 | ||||||
| 2025 | 50.5 | 54.2 | 1,068.4 | — | 1.8 | 1,174.9 | ||||||
| 2026 | 658.4 | 46.2 | 1,009.3 | — | — | 1,713.9 | ||||||
| 2027 | 4.0 | 40.7 | — | — | — | 44.7 | ||||||
| Thereafter | 1,576.2 | 627.4 | — | 2,200.0 | — | 4,403.6 | ||||||
| Total | $ | 2,535.7 | $ | 838.8 | $ | 2,077.7 | $ | 2,200.0 | $ | 52.9 | $ | 7,705.1 |
- Debt maturities include the unamortized deferred financing costs and discount / premiums associated with outstanding debt.
- For the secured debt maturing between 2023 – 2027:
| 2023 | 2024 | 2025 | 2026 | 2027 | |
| Weighted average interest rate | 3.54 % | 4.03 % | 4.04 % | 3.97 % | 4.34 % |
- This debt was paid off with proceeds from the new secured loan that the Company entered into subsequent to the quarter ended September 30, 2023. The new $252.8 million loan matures in November 2030 and bears interest at a fixed rate of 6.49%.
Debt Analysis
As of September 30, 2023
| Select Credit Ratios | |||
| Net debt / TTM recurring EBITDA(a) | 6.1 x | ||
| Net debt / enterprise value | 33.2 % | ||
| Net debt / gross assets | 36.7 % | ||
| Unencumbered assets / total assets | 77.0 % | ||
| Floating rate debt / total debt(b) | 17.5 % | ||
| Coverage Ratios | |||
| TTM Recurring EBITDA(a) / interest | 4.0 x | ||
| TTM Recurring EBITDA(a) / interest + preferred distributions + preferred stock distribution | 4.0 x | ||
| Senior Credit Facility Covenants | Requirement | ||
| Maximum leverage ratio | <65.0 % | 33.9 % | |
| Minimum fixed charge coverage ratio | >1.40 x | 3.23 x | |
| Maximum secured leverage ratio | <40.0 % | 12.5 % | |
| Senior Unsecured Note Covenants | Requirement | ||
| Total debt / total assets | ≤60.0 % | 41.0 % | |
| Secured debt / total assets | ≤40.0 % | 17.9 % | |
| Consolidated income available for debt service / debt service | ≥1.50 x | 3.99 x | |
| Unencumbered total asset value / total unsecured debt | ≥150.0 % | 334.0 % |
- Refer to page 8 for additional detail on the Company’s TTM Recurring EBITDA.
- Percentage includes the impact of hedge activities.
Debt Maturities ($ in millions)^
^ Excludes the Company’s borrowings under its senior credit facility.
Definitions and Notes
Capital Expenditures and Investment Activity – The Company classifies its investments in properties into the following categories:
- Recurring Capital Expenditures – Property recurring capital expenditures are necessary to maintain asset quality, including purchasing and replacing items used to operate the communities and marinas. Recurring capital expenditures at the Company’s MH and RV properties include major road, driveway and pool improvements; clubhouse renovations; adding or replacing streetlights; playground equipment; signage; maintenance facilities; manager housing and property vehicles. Recurring capital expenditures at the Company’s marinas include dredging, dock repairs and improvements, and equipment maintenance and upgrades. The minimum capitalized amount is five hundred dollars.
- Non-Recurring Capital Expenditures – The following investment and reinvestment activities are non-recurring in nature:
- Lot Modifications – Lot modification capital expenditures are incurred to modify the foundational structures required to set a new home after a previous home has been removed. These expenditures are necessary to create a revenue stream from a new site renter and often improve the quality of the community. Other lot modification expenditures include land improvements added to annual RV sites to aid in the conversion of transient RV guests to annual contracts. See page 13 for move-out rates.
- Growth Projects – Growth projects consist of revenue-generating or expense-reducing activities at the properties. These include, but are not limited to, utility efficiency and renewable energy projects, site, slip or amenity upgrades, such as the addition of a garage, shed or boat lift, and other special capital projects that substantiate an incremental rental increase.
- Rebranding – Rebranding includes new signage at the Company’s RV communities and costs of building an RV mobile application and updated website.
- Acquisitions – Total acquisition investments represent the purchase price paid for operating properties and land parcels for future ground-up development and expansions activities (detailed for the current calendar year on page 14), plus any capital improvements identified during due diligence needed to bring acquired properties up to the Company’s operating standards.
Capital improvements subsequent to acquisition often require 24 to 36 months to complete after closing and include upgrading clubhouses; landscaping; new street light systems; new mail delivery systems; pool renovations including larger decks, heaters and furniture; new maintenance facilities; lot modifications; and new signage including main signs and internal road signs.
For the nine months ended September 30, 2023, the components of total acquisition investment are as follows (in millions):
Nine Months Ended September 30, 2023
MH and RV Marina Total
| Purchase price of property acquisitions | $ | 7.2 | $ | 100.6 | $ | 107.8 |
| Capitalized transaction costs for property acquisitions | 5.0 | 1.6 | 6.6 | |||
| Purchase price of land acquisitions (including capitalized transaction costs)(a) | 36.7 | — | 36.7 | |||
| Capital improvements to recent property acquisitions | 98.3 | 69.9 | 168.2 | |||
| Total Acquisition Investments | $ | 147.2 | $ | 172.1 | $ | 319.3 |
(a) Includes the value allocated to infrastructure improvements associated with acquired land, when applicable.
- Expansions and Developments – Expansion and development expenditures consist primarily of construction costs such as roads, activities, and amenities, and costs necessary to complete site improvements, such as driveways, sidewalks and landscaping at the Company’s MH and RV communities. Expenditures also include costs to rebuild after damage has been incurred at MH, RV or marina properties, and research and development.
Enterprise Value – Equals total equity market capitalization, plus total indebtedness reported on the Company’s balance sheet and less cash and cash equivalents (excluding restricted cash).
GAAP – U.S. Generally Accepted Accounting Principles.
Home Sales Contribution to FFO – The reconciliation of NOI from home sales to FFO from home sales for the quarter and nine months ended September 30, 2023 is as follows (in millions):
Quarter Ended September 30, 2023 Nine Months Ended September 30, 2023
North America UK Total North America UK Total
| Home Sales NOI | $ | 14.4 | $ | 22.9 | $ | 37.3 | $ | 41.7 | $ | 60.1 | $ | 101.8 | |
| Gain on dispositions of assets, net | (9.6) | (0.9) | (10.5) | (28.2) | (0.8) | (29.0) | |||||||
| FFO Contribution from home sales | $ | 4.8 | $ | 22.0 | $ | 26.8 | $ | 13.5 | $ | 59.3 | $ | 72.8 |
Interest Expense – The following is a summary of the components of the Company’s interest expense (in millions):
Quarter Ended Nine Months Ended
September 30, September 30, September 30, September 30,
2023 2022 2023 2022
| Interest on Secured debt, Senior unsecured notes, Senior Credit Facility, Unsecured Term Loan and interest rate swaps | $ | 81.0 $ | 57.2 | $ | 228.5 $ | 151.5 |
| Lease related interest expense | 3.6 | 2.9 | 10.7 | 5.6 | ||
| Amortization of deferred financing costs, debt (premium) or discounts and losses on hedges | 1.5 | 1.3 | 4.5 | 3.7 | ||
| Senior credit facility commitment fees and other finance related charges | 1.8 | 1.6 | 5.1 | 5.5 | ||
| Capitalized interest | (3.8) | (1.3) | (8.9) | (4.1) | ||
| Interest Expense, per Consolidated Statements of Operations | $ | 84.1 $ | 61.7 | $ | 239.9 $ | 162.2 |
NAREIT – The National Association of Real Estate Investment Trusts is the worldwide representative voice for REITs and real estate companies with an interest in U.S. real estate and capital markets. More information is available at www.reit.com.
Net Debt – The carrying value of debt, which includes unamortized premiums, discounts and deferred financing costs, less, unrestricted cash (i.e., cash and cash equivalents, excluding restricted cash).
Other Acquisition Related Costs – In the Company’s Reconciliation of Net Income Attributable to SUI Common Shareholders to Core FFO on page 6, ‘Other acquisition related costs’ represent (a) nonrecurring integration expenses associated with acquisitions during the quarter and nine months ended September 30, 2023 and 2022, (b) costs associated with potential acquisitions that will not close, (c) costs associated with the termination of the bridge loan commitment during the quarter ended March 31, 2022 related to the acquisition of Park Holidays and (d) expenses incurred to bring recently acquired properties up to the Company’s operating standards, including items such as tree trimming and painting costs that do not meet the Company’s capitalization policy.
Other adjustments, net – In the Company’s Reconciliation of Net Income Attributable to SUI Common Shareholders to Core FFO on page 6, ‘Other adjustments, net’ consists of the following (in millions):
Quarter Ended Nine Months Ended
September 30, 2023 September 30, 2022 September 30, 2023 September 30, 2022
| Litigation settlement | $ | — $ | (3.4) | $ | — $ | (3.4) |
| Long term lease termination (benefit) / expense | 3.3 | 0.2 | 4.0 | (0.1) | ||
| Severance costs | 0.1 | — | 0.5 | — | ||
| Deferred tax benefit | (2.3) | (3.6) | (14.6) | (3.9) | ||
| RV rebranding non-recurring cost | — | — | — | 2.2 | ||
| Accelerated deferred compensation amortization | — | 0.3 | 0.4 | 0.4 | ||
| Other | — | — | 0.1 | (0.3) | ||
| Other adjustments, net | $ | 1.1 $ | (6.5) | $ | (9.6) $ | (5.1) |
Other income / (expense), net – In the Company’s Consolidated Statements of Operations on page 5, ‘Other income / (expense), net’ consists of the following (in millions):
Quarter Ended Nine Months Ended
September 30, 2023 September 30, 2022 September 30, 2023 September 30, 2022
| Litigation settlement | $ | — $ | 3.4 | $ | — $ | 3.4 |
| Long term lease termination benefit / (expense) | (3.3) | (0.2) | (4.0) | 0.1 | ||
| Repair reserve on repossessed homes | (1.0) | (0.4) | (2.2) | (0.9) | ||
| Other | 0.6 | — | 0.7 | — | ||
| Other income / (expense), net | $ | (3.7) $ | 2.8 | $ | (5.5) $ | 2.6 |
Same Property – The Company defines Same Properties as those the Company has owned and operated continuously since at least January 1, 2022. Same properties exclude ground-up development properties, acquired properties and properties sold after December 31, 2021. The Same Property data may change from time-to-time depending on acquisitions, dispositions, management discretion, significant transactions or unique situations.
Securities – The Company had the following securities outstanding as of September 30, 2023:
Number of Units / If Converted to
Shares Outstanding Conversion Common shares Issuance Price Annual
(in thousands) Rate(a) (in thousands)(b) Per Unit Distribution Rate
| Non Convertible Securities | |||||||||
| Common shares | 124,447 | N/A | N/A | N/A | $3.72(c) | ||||
| Convertible Securities Classified as Equity | |||||||||
| Common OP units | 2,632 | 1.0000 | 2,632 | N/A | Mirrors common share distributions | ||||
| Preferred OP Units | |||||||||
| Series A-1 | 202 | 2.4390 | 493 | $ | 100.00 | 6.00 % | |||
| Series A-3 | 40 | 1.8605 | 75 | $ | 100.00 | 4.50 % | |||
| Series C | 306 | 1.1100 | 340 | $ | 100.00 | 5.00 % | |||
| Series D | 489 | 0.8000 | 391 | $ | 100.00 | 4.00 % | |||
| Series E | 80 | 0.6897 | 55 | $ | 100.00 | 5.50 % | |||
| Series F | 90 | 0.6250 | 56 | $ | 100.00 | 3.00 % | |||
| Series G | 211 | 0.6452 | 136 | $ | 100.00 | 3.20 % | |||
| Series H | 581 | 0.6098 | 355 | $ | 100.00 | 3.00 % | |||
| Series J | 238 | 0.6061 | 144 | $ | 100.00 | 2.85 % | |||
| Series K | 1,000 | 0.5882 | 588 | $ | 100.00 | 4.00 % | |||
| Total | 3,237 | 2,633 | |||||||
| Total convertible securities outstanding | 5,869 | 5,265 | |||||||
| Convertible Securities Classified as Debt | |||||||||
| Aspen preferred OP units | 315 | 0.3320 | 105 | $ | 27.00 | Variable |
- Exchange rates are subject to adjustment upon stock splits, recapitalizations and similar events. The exchange rates of certain series of OP units are approximated to four decimal places.
- Calculation may yield minor differences due to fractional shares paid in cash to the shareholder at conversion. (c) Annual distribution is based on the last quarterly distribution annualized.
Share – In addition to reporting net income on a diluted basis (“EPS”), the Company reports FFO and Core FFO on a per common share and dilutive convertible securities basis (per “Share”). For the periods presented below, the Company’s diluted weighted average common shares outstanding for EPS and FFO are as follows:
Quarter Ended Nine Months Ended
September 30, September 30, September 30, September 30,
2023 2022 2023 2022
| Diluted Weighted Average Common Shares Outstanding – EPS | ||||||||
| Weighted average common shares outstanding – Basic | 123.5 | 122.4 | 123.4 | 119.2 | ||||
| Common shares dilutive effect from forward equity sale | — | — | — | 0.2 | ||||
| Dilutive restricted stock | — | — | — | — | ||||
| Common and preferred OP units dilutive effect | — | 0.4 | — | 2.5 | ||||
| Weighted Average Common Shares Outstanding – Diluted | 123.5 | 122.8 | 123.4 | 121.9 | ||||
| Diluted Weighted Average Common Shares Outstanding – FFO | ||||||||
| Weighted average common shares outstanding – Basic | 123.5 | 122.4 | 123.4 | 119.2 | ||||
| Common shares dilutive effect from forward equity sale | — | — | — | 0.2 | ||||
| Restricted stock | 0.2 | 0.3 | 0.4 | 0.4 | ||||
| Common OP units | 2.6 | 2.5 | 2.5 | 2.5 | ||||
| Common stock issuable upon conversion of certain preferred OP units | 1.7 | 1.5 | 2.0 | 3.1 | ||||
| Weighted Average Common Shares Outstanding – Diluted | 128.0 | 126.7 | 128.3 | 125.4 |
Non-GAAP Supplemental Measures
Investors and analysts following the real estate industry use non-GAAP supplemental performance measures, including net operating income (“NOI”), earnings before interest, tax, depreciation and amortization (“EBITDA”) and funds from operations (“FFO”) to assess REITs. The Company believes that NOI, EBITDA and FFO are appropriate measures given their wide use by and relevance to investors and analysts. Additionally, NOI, EBITDA and FFO are commonly used in various ratios, pricing multiples, yields and returns and valuation calculations used to measure financial position, performance and value.
NOI provides a measure of rental operations that does not factor in depreciation, amortization and non-property specific expenses such as general and administrative expenses.
EBITDA provides a further measure to evaluate ability to incur and service debt; EBITDA also provides further measures to evaluate the Company’s ability to fund dividends and other cash needs.
FFO, reflecting the assumption that real estate values rise or fall with market conditions, principally adjusts for the effects of GAAP depreciation and amortization of real estate assets.
- Net Operating Income (“NOI”)
◦ Total Portfolio NOI – The Company calculates NOI by subtracting property operating expenses and real estate taxes from operating property revenues. NOI is a non-GAAP financial measure that the Company believes is helpful to investors as a supplemental measure of operating performance because it is an indicator of the return on property investment and provides a method of comparing property performance over time. The Company uses NOI as a key measure when evaluating performance and growth of particular properties and / or groups of properties. The principal limitation of NOI is that it excludes depreciation, amortization, interest expense and non-property specific expenses such as general and administrative expenses, all of which are significant costs. Therefore, NOI is a measure of the operating performance of the properties of the Company rather than of the Company overall. The Company believes that NOI provides enhanced comparability for investor evaluation of properties performance and growth over time.
The Company believes that GAAP net income (loss) is the most directly comparable measure to NOI. NOI should not be considered to be an alternative to GAAP net income (loss) as an indication of the Company’s financial performance or GAAP cash flow from operating activities as a measure of the Company’s liquidity; nor is it indicative of funds available for the Company’s cash needs, including its ability to make cash distributions. Because of the inclusion of items such as interest, depreciation and amortization, the use of GAAP net income (loss) as a performance measure is limited as these items may not accurately reflect the actual change in market value of a property, in the case of depreciation and in the case of interest, may not necessarily be linked to the operating performance of a real estate asset, as it is often incurred at a parent company level and not at a property level.
◦ Same Property NOI – This is a key management tool used when evaluating performance and growth of the Company’s Same Property portfolio. The Company believes that Same Property NOI is helpful to investors as a supplemental comparative performance measure of the income generated from the Same property portfolio from one period to the next. Same Property NOI does not include the revenues and expenses related to home sales, service, retail, dining and entertainment activities at the properties.
- Earnings before interest, tax, depreciation and amortization (“EBITDA“)
◦ EBITDAre – NAREIT refers to EBITDA as “EBITDAre” and calculates it as GAAP net income (loss), plus interest expense, plus income tax expense, plus depreciation and amortization, plus or minus losses or gains on the disposition of depreciated property (including losses or gains on change of control), plus impairment write-downs of depreciated property and of investments in nonconsolidated affiliates caused by a decrease in value of depreciated property in the affiliate, and adjustments to reflect the entity’s share of EBITDAre of nonconsolidated affiliates. EBITDAre is a non-GAAP financial measure that the Company uses to evaluate its ability to incur and service debt, fund dividends and other cash needs and cover fixed costs. Investors utilize EBITDAre as a supplemental measure to evaluate and compare investment quality and enterprise value of REITs. Investors utilize EBITDAre as a supplemental measure to evaluate and compare investment quality and enterprise value of REITs.
◦ Recurring EBITDA – The Company also uses EBITDAre excluding certain gain and loss items that management considers unrelated to measurement of the Company’s performance on a basis that is independent of capital structure (“Recurring EBITDA”). The Company believes that GAAP net income (loss) is the most directly comparable measure to EBITDAre. EBITDAre is not intended to be used as a measure of the Company’s cash generated by operations or its dividend-paying capacity, and should therefore not replace GAAP net income (loss) as an indication of the Company’s financial performance or GAAP cash flow from operating, investing and financing activities as measures of liquidity.
- Funds from Operations (“FFO”)
◦ FFO – NAREIT defines FFO as GAAP net income (loss), excluding gains (or losses) from sales of depreciable operating property, plus real estate related depreciation and amortization, real estate related impairments, and after adjustments for nonconsolidated partnerships and joint ventures. FFO is a non-GAAP financial measure that management believes is a useful supplemental measure of the Company’s operating performance. By excluding gains and losses related to sales of previously depreciated operating real estate assets, real estate related impairment and real estate asset depreciation and amortization (which can vary among owners of identical assets in similar condition based on historical cost accounting and useful life estimates), FFO provides a performance measure that, when compared period-over-period, reflects the impact to operations from trends in occupancy rates, rental rates and operating costs, providing perspective not readily apparent from GAAP net income (loss). Management believes the use of FFO has been beneficial in improving the understanding of operating results of REITs among the investing public and making comparisons of REIT operating results more meaningful.
◦ Core FFO – In addition to FFO, the Company uses FFO excluding certain gain and loss items that management considers unrelated to the operational and financial performance of the Company’s core business (“Core FFO”). The Company believes that Core FFO provides enhanced comparability for investor evaluations of period-over-period results.
The Company believes that GAAP net income (loss) is the most directly comparable measure to FFO. The principal limitation of FFO is that it does not replace GAAP net income (loss) as a financial performance measure or GAAP cash flow from operating activities as a measure of the Company’s liquidity. Because FFO excludes significant economic components of GAAP net income (loss) including depreciation and amortization, FFO should be used as a supplement to GAAP net income (loss) and not as an alternative to it. Furthermore, FFO is not intended as a measure of a REIT’s ability to meet debt principal repayments and other cash requirements, nor as a measure of working capital. FFO is calculated in accordance with the Company’s interpretation of standards established by NAREIT, which may not be comparable to FFO reported by other REITs that interpret the NAREIT definition differently.
Certain financial information has been revised to reflect reclassifications in prior periods to conform to current period presentation. ##
Part II – Additional Information with More MHProNews Analysis and Commentary in Brief
There are four broad ways that will be mentioned here for approaching Sun Communities (SUI), without taking a scalpel to dissect their financials, quarterly, and year to date reporting.
One is to look at several 2023 related reports that frames Sun and their leadership. That will be done below.
Two, is to lift the hood some of Sun’s key remarks from their investor relations report. From page 10 of their IR pitch deck are these remarks.
- COMPELLING SUPPLY-DEMAND FUNDAMENTALS
- Virtually no new supply has been added for years
The implications of the above will be a focus for much of what follows.
Three, is related to Two, because of the Q&A with Bing AI that will follow, which was teed up in the preface at the top. It will reveal why Sun investors, stakeholders, plaintiffs’ attorneys, and public officials ought to wonder why Sun leaders are risking more potential litigation?
Four, there are what at-a-glance ought to be another set of business model/performance metrics – question marks.
For example.
- If Sun had 55,000 applications to live in a Sun Communities in 2022, why aren’t they at 100 percent capacity for most of their communities? When they have relatively modest vacancy rates, what happens to the majority of those applications? What is the ratio of new or pre0wned sales and other move-ins?
- Given the favorable rental comparisons from page 21 of their pitch deck, why aren’t they at 100 percent capacity with a waiting list?
Note: to expand this image to a larger or full size, see the instructions
below the graphic below or click the image and follow the prompts.
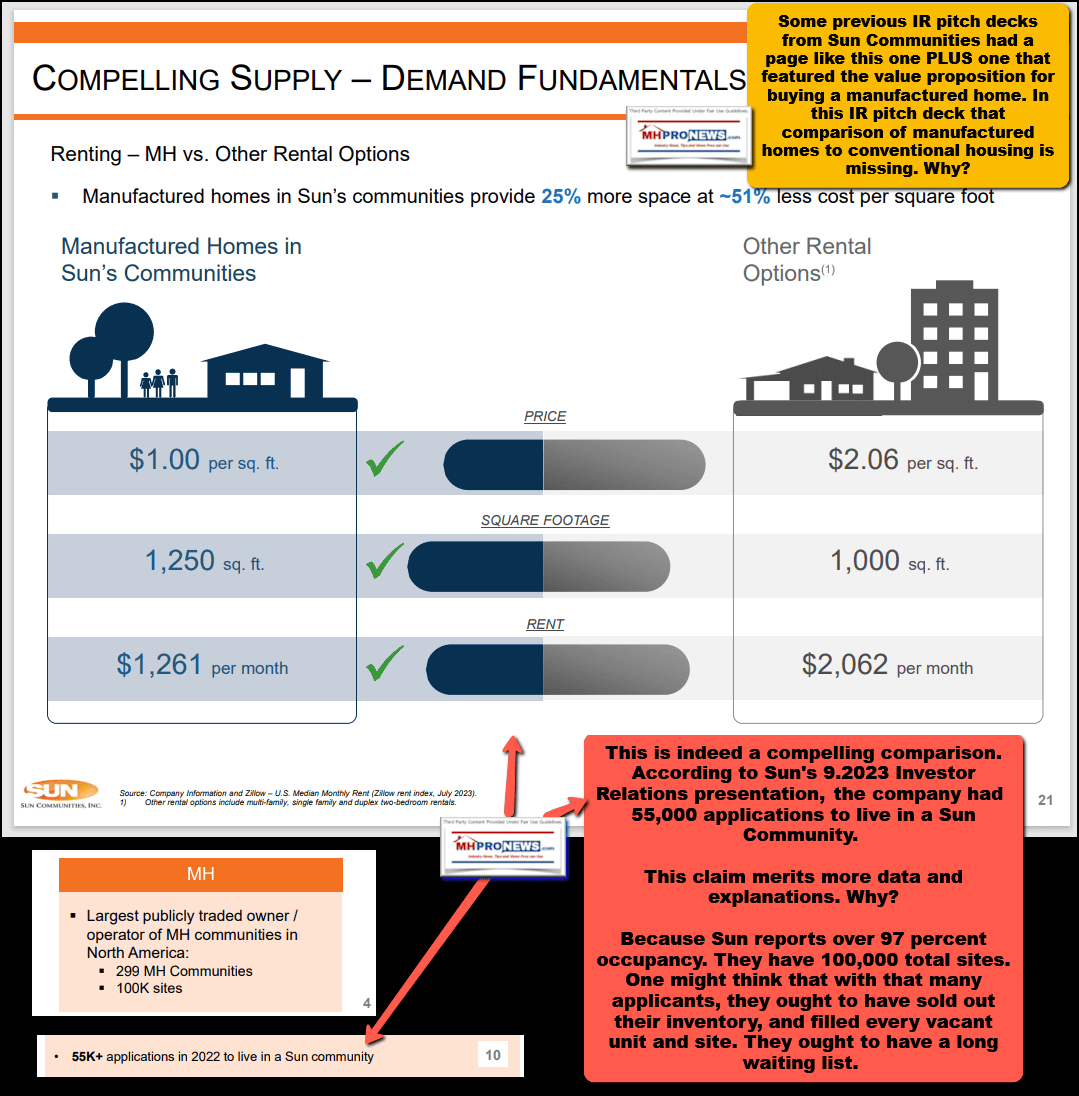
This claim merits more data and explanations. Why?
Because Sun reports over 97 percent occupancy. They have 100,000 total sites. One might think that with that many applicants, they ought to have sold out their inventory, and filled every vacant unit and site. They ought to have a long waiting list.
Note: depending on your browser or device, many images in this report can be clicked to expand. For example, in some browsers/devices you click the image and select ‘open in a new window.’ After clicking that selection, you click the image in the open window to expand the image to a larger size. To return to this page, use your back key, escape or follow the prompts.
- Given the remarks by Gary Shiffman below, why are they so focused on keeping new development limited when Shiffman himself said that developing can be more profitable?

To frame this Q&A with Bing AI, one must consider the validity of their business thesis. True, limiting numbers of manufactured home communities and low (if not negative) total national land-lease communities may seem to yield short term pressures for higher site fees and compressed cap rates. But the remarks by Shiffman above, “we can actually develop communities to a better return for our shareholders than buying them at the cap rates that they’re trading at currently” ought to beg a host of questions. That being so, why isn’t that at the heart of their business strategy? And what impact does their current course at Sun, which is also similar to the one taken by Equity LifeStyle Properties (ELS) or Flagship Communities and several others, have on the manufactured housing industry as a whole, or the Manufactured Housing Institute (MHI) where Sun holds an MHI board of directors’ seat?
The Big Picture and Sun Communities Place in It
> “Confirm or clarify the following, please. Per information published by Manufactured Home Pro News, statements FEMA and George McCarthy with the Lincoln Institute, and other data, there may be thousands of fewer land lease manufactured home communities nationally in 2023 than in 2000, correct?”
I also found an article on Manufactured Home Pro News that corrects a factual error in an earlier article that cited George McCarthy. The corrected statement reads: “parks containing about a fifth of mobile home lots nationwide have been purchased by institutional investors over the past eight years” 2. This statement does not directly relate to the number of land lease manufactured home communities in the United States.
I hope this helps clarify your question. Let me know if you have any further questions or if there is anything else I can help you with.
Learn more:
> “The estimated number of manufactured home communities indicated that there were about 55,000 manufactured home communities circa 2000. So, if there are about 50,393 land lease communities now, then that would indicate a declining number, correct? Also, while several dozen new manufactured home communities have been developed nationally, per known information, the number of new communities opening are apparently far fewer than those being sold and closed for redevelopment or other purposes. Kindly confirm or clarify those points, please.”
Regarding your second point, I could not find any information on the exact number of new manufactured home communities opening nationally. However, I found an article on Manufactured Home Pro News that states that “parks containing about a fifth of mobile home lots nationwide have been purchased by institutional investors over the past eight years” 3. This suggests that there may be a trend of institutional investors buying up existing communities rather than developing new ones.
I hope this helps clarify your question. Let me know if you have any further questions or if there is anything else I can help you with.
Learn more:
- manufacturedhomepronews.com 2. thespruce.com 3. multihousingnews.com 4. claytonhomes.com 5. bobvila.com 6. mhvillage.com 7. hud.gov 8. census.gov 9. mobilehomeuniversity.com
> “Largely agree, thanks. It seems there are several publicly traded companies in manufactured home community sector that have said in their investor relations packages information to the effect that a lack of new development and thousands of privately owned (fragmented industry) properties means that the supply demand imbalance favors consolidators, correct? Aren’t there several investor relations packages for consolidators of manufactured home communities that say that in their own words?”
Yes, that is correct. According to a report by JLL, the manufactured housing industry has experienced consolidation of single-asset and smaller portfolios, driving valuations upward 1. The report also states that capitalization rates for the manufactured housing sector continue to compress, displaying increased investor confidence in the performance of the sector going forward 2.
I hope this helps clarify your question. Let me know if you have any further questions or if there is anything else I can help you with.
Learn more:
> “Sun Communities, Flagship Communities, and Equity LifeStyle Properties are among those that have a board seat with the Manufactured Housing Institute, isn’t that correct?”
I hope this helps clarify your question. Let me know if you have any further questions or if there is anything else I can help you with.
Learn more:
> “Several Manufactured Housing Institute leaders are on record saying that they want to see enhanced preemption under the Manufactured Housing Institute to be routinely and robustly enforced, correct?”
I hope this helps clarify your question. Let me know if you have any further questions or if there is anything else I can help you with.
Learn more:
- manufacturedhomepronews.com2. manufacturedhomepronews.com3. manufacturedhomepronews.com4. manufacturedhomelivingnews.com5. manufacturedhomepronews.com“
> “Okay. The Manufactured Housing Institute and the Manufactured Housing Association for Regulatory Reform (MHARR) both have reported that manufactured home production is down significantly year to date in 2023 vs. the same period year to date in 2022, correct?”
I could not find any information on whether the Manufactured Housing Institute (MHI) has reported a decline in manufactured home production for 2023. However, I found an article on Manufactured Home Pro News that states that some leaders of the MHI have called for enhanced preemption under the Manufactured Housing Improvement Act (MHIA) to be routinely and robustly enforced by the Department of Housing and Urban Development (HUD) 2. The report also states that due to lax enforcement of preemption by HUD, many localities use construction requirements that deviate from the HUD Code to accomplish an underlying objective of zoning out manufactured housing (or making it prohibitively expensive) 2.
I hope this helps clarify your question. Let me know if you have any further questions or if there is anything else I can help you with.
Learn more:
- manufacturedhousingassociationregulatoryreform.org2. manufacturedhousingassociationregulatoryreform.org3. manufacturedhousingassociationregulatoryreform.org“
> “Actually, Manufactured Home Pro News (MHProNews) has recently reported MHI’s August 2023 data at this link here. https://www.manufacturedhomepronews.com/tipster-provides-secret-for-members-only-document-but-why-manufactured-housing-institute-mhi-monthly-economic-report-for-august-2023-data-released-in-october-2/ Then, Cavco’s Bill Boor, who is now the Chairman of the Manufactured Housing Institute said that manufactured housing industry production was down sharply in his testimony to Congress on July 14, 2023, correct?”
Additionally, according to a report by Manufactured Home Pro News, Bill Boor, who is now the Chairman of the Manufactured Housing Institute (MHI), testified to Congress on July 14, 2023 that manufactured housing industry production was down sharply 1.
I hope this helps clarify your question. Let me know if you have any further questions or if there is anything else I can help you with.
Learn more:
- manufacturedhousingassociationregulatoryreform.org2. manufacturedhousingassociationregulatoryreform.org3. manufacturedhousingassociationregulatoryreform.org“
> “There are several sources, not just the Manufactured Housing Institute, or the Manufactured Housing Association for Regulatory Reform (MHARR) that have said that zoning and financing limitations have blunted manufactured housing production, correction? And that enforcing the enhanced preemption provision of the Manufactured Housing Improvement Act of 2000 (MHIA) could be used to overcome those zoning and placement challenges if it were routinely and vigorously enforced by HUD, correct?”
I hope this helps clarify your question. Let me know if you have any further questions or if there is anything else I can help you with.
Learn more:
- manufacturedhomepronews.com2. manufacturedhousingassociationregulatoryreform.org3. manufacturedhomepronews.com4. manufacturedhousingassociationregulatoryreform.org5. manufacturedhousingassociationregulatoryreform.org 6. multifamily.fanniemae.com 7. fhfa.gov 8. manufacturedhomepronews.com 9. manufacturedhomepronews.com“
> “You linked on the FHFA website a Listening Session presentation entitled a Pimple on an Elephant’s Ass. It outlines competitive and regulatory forces in or beyond manufactured housing that are limiting manufactured home sales, correct?”
Yes, that is correct. According to a report by Manufactured Home Pro News, the Federal Housing Finance Agency (FHFA) hosted a listening session on March 25, 2021, on the Enterprise Housing Goals (EHG) for Fannie Mae and Freddie Mac 1. During the session, L. A. “Tony” Kovach delivered a presentation entitled “A Pimple on an Elephant’s Ass,” which outlined competitive and regulatory forces in or beyond manufactured housing that are limiting manufactured home sales 23.
I hope this helps clarify your question. Let me know if you have any further questions or if there is anything else I can help you with.
Learn more:
> “Okay, so ELS, Sun Communities, Flagship Communities, and MHPI have made statements that for their business model, they benefit from a lack of new developments of manufactured home communities, correct? Yet, the Manufactured Housing Institute has repeatedly said that they want to see enhanced preemption under the Manufactured Housing Improvement Act of 2000 (MHIA) to be vigorously enforced by HUD, correct? Aren’t those two views seemingly at odds?”
Yes, that is correct. According to a report by Manufactured Home Pro News, some manufactured home community operators such as Equity LifeStyle Properties (ELS), Sun Communities, Flagship Communities, and Manufactured Housing Properties Inc (MHPI) have stated that their business model benefits from a lack of new developments of manufactured home communities 1.”
On the other hand, the Manufactured Housing Institute (MHI) has repeatedly called for enhanced preemption under the Manufactured Housing Improvement Act of 2000 (MHIA) to be vigorously enforced by the Department of Housing and Urban Development (HUD) 23. The MHIA’s enhanced preemption provision is designed to prevent state and local governments from imposing discriminatory or exclusionary zoning laws on manufactured housing 3.
While these two views may seem at odds, it is important to note that the MHI’s call for enhanced preemption is aimed at removing regulatory barriers to the growth of the manufactured housing industry. The MHI believes that enhanced preemption will help increase the availability and affordability of manufactured housing for moderate and lower-income Americans 3.
I hope this helps clarify your question. Let me know if you have any further questions or if there is anything else I can help you with.
Learn more:
- manufacturedhomepronews.com2. manufacturedhomepronews.com3. manufacturedhomepronews.com4. manufacturedhomepronews.com5. einpresswire.com6. einpresswire.com7. manufacturedhousingassociationregulatoryreform.org8. manufacturedhomepronews.com“
> “Okay, can you find any public comments by the Manufactured Housing Institute that promote enhanced preemption under the Manufactured Housing Improvement Act of 2000 on their own website? Or in a Manufactured Housing Institute press release?”
I could not find any public comments by the Manufactured Housing Institute (MHI) that promote enhanced preemption under the Manufactured Housing Improvement Act of 2000 (MHIA) on their own website. However, I found a press release on EIN Presswire that reports that the Manufactured Housing Association for Regulatory Reform (MHARR) has called for HUD to fully comply with existing laws, including the MHIA’s enhanced preemption provision 1.
I also found an article on Manufactured Home Pro News that reports on a statement made by MHI Vice Chairman Bill Boor to Congress on July 14, 2023. Boor called on Congress to pass H.R. 3327, the “Manufactured Housing Affordability and Energy Efficiency Act of 2023,” and highlighted the Department of Energy’s (DOE) Energy Conservation Standards for Manufactured Housing as an example of a federal agency implementing an environmental policy without fully understanding the broader consequences 2.
I hope this helps clarify your question. Let me know if you have any further questions or if there is anything else I can help you with.
Learn more:
- com2. manufacturedhomepronews.com3. manufacturedhousing.org4. manufacturedhomelivingnews.com5. manufacturedhomepronews.com6. who13.com7. einnews.com8. manufacturedhousingassociationregulatoryreform.org9. manufacturedhomepronews.com“
> “What could explain why the Manufactured Housing Institute hasn’t posted on their own website any information on the enhanced preemption clause of the Manufactured Housing Improvement Act of 2000? Shouldn’t that be a common sense place to promote a position that they have repeatedly said in emailed remarks or comment to public officials that they support?”
I could not find any information on why the Manufactured Housing Institute (MHI) has not posted any information on the enhanced preemption clause of the Manufactured Housing Improvement Act of 2000 (MHIA) on their own website. However, I found a press release on EIN Presswire that reports that the Manufactured Housing Association for Regulatory Reform (MHARR) has called for HUD to fully comply with existing laws, including the MHIA’s enhanced preemption provision 1.
It is possible that the MHI has not posted any information on enhanced preemption on their website because they may have other priorities or initiatives that they are focusing on. However, I could not find any official statement from the MHI regarding this matter.
I hope this helps clarify your question. Let me know if you have any further questions or if there is anything else I can help you with.
Learn more:
- einpresswire.com2. manufacturedhomepronews.com3. who13.com4. einnews.com5. manufacturedhousing.org6. manufacturedhomelivingnews.com7. manufacturedhomepronews.com8. manufacturedhousingassociationregulatoryreform.org9. manufacturedhomepronews.com“
> “You made an interesting point in saying: “It is possible that the MHI (i.e.: the Manufactured Housing Institute) has not posted any information on enhanced preemption on their website because they may have other priorities or initiatives that they are focusing on.” Given that MHI has Equity LifeStyle Properties, Sun Communities, and Flagship Communities executives on their board of directors https://www.manufacturedhousing.org/about-mhi/leadership/ and given that those firms have stated in their investor relations materials that limiting new development is an advantage, couldn’t that help explain why Manufactured Housing Institute has not posted anything on their website about enhanced preemption under the Manufactured Housing Institute website?”
Yes, it is possible that the Manufactured Housing Institute (MHI) has not posted any information on enhanced preemption under the Manufactured Housing Improvement Act of 2000 (MHIA) on their website due to other priorities or initiatives that they are focusing on. It is also possible that the MHI has not posted any information on enhanced preemption because it may be a sensitive topic for some of its board members who have stated in their investor relations materials that limiting new development is an advantage 12.
However, I could not find any official statement from the MHI regarding this matter.
I hope this helps clarify your question. Let me know if you have any further questions or if there is anything else I can help you with.
Learn more:
- equitylifestyleproperties.com2. suncommunities.com3. manufacturedhousing.org4. bing.com5. manufacturedhomepronews.com6. manufacturedhousing.org7. equitylifestyle.gcs-web.com8. equitylifestyle.gcs-web.com9. manufacturedhomepronews.com“
Okay. Let’s pivot to a related topic. Clayton Homes consolidated (acquired) several production (builders) brands in manufactured housing industry in the 21st century until they reached about 50 percent market share. More recently, Cavco Industries (CVCO) and Skyline Champion (SKY) have been consolidating several manufacturers and retail operations. Cavco and Skyline Champion have both said in their investor presentations and in remarks during earnings calls that acquisitions are an important part of their business plan, correct?
Yes, that is correct. According to a report by Forbes, Cavco Industries and Skyline Champion have both been consolidating several manufacturers and retail operations 1. Both companies have stated in their investor presentations and remarks during earnings calls that acquisitions are an important part of their business plan 1.
Clayton Homes, a subsidiary of Berkshire Hathaway, has also consolidated several production brands in the manufactured housing industry in the 21st century until they reached about 50 percent market share 2.
I hope this helps clarify your question. Let me know if you have any further questions or if there is anything else I can help you with.
Learn more:
> “Okay. So, according to reports that cite the data published on Manufactured Home Pro News production of new HUD Code manufactured homes by the manufactured housing industry has actually declined substantially since the Manufactured Housing Improvement Act (MHIA) of 2000 and its enhanced preemption provision was enacted, correct?”
Yes, that is correct. According to a report by the Manufactured Housing Association for Regulatory Reform (MHARR), the year-over-year production of HUD Code manufactured homes declined by 19.1% in August 2023, with 8,670 new homes produced compared to 10,722 new homes produced in August 2022 1. The cumulative production for 2023 is now 58,692 homes, which is a 27% decrease from the 80,431 homes produced over the same period in 2022 1.
I hope this helps clarify your question. Let me know if you have any further questions or if there is anything else I can help you with.
Learn more:
- manufacturedhousingassociationregulatoryreform.org 2. manufacturedhomelivingnews.com 3. manufacturedhomepronews.com 4. einpresswire.com 5. manufacturedhomepronews.com“
> “Okay, so in this market environment of dramatically reduced manufactured home production during a well documented affordable housing crisis, the stated purpose of the Manufactured Housing Improvement Act (MHIA) of boosting access to more affordable homes, has for whatever reasons not been accomplished. Production is down dramatically since 1998 and 2000, the years when the efforts to enact and finally pass the MHIA and enhanced preemption was made federal law, correct?”
Yes, that is correct. According to a report by the Manufactured Housing Association for Regulatory Reform (MHARR), the year-over-year production of HUD Code manufactured homes declined by 19.1% in August 2023, with 8,670 new homes produced compared to 10,722 new homes produced in August 2022 1. The cumulative production for 2023 is now 58,692 homes, which is a 27% decrease from the 80,431 homes produced over the same period in 2022 1.
The decline in production of manufactured homes has been a long-standing issue. According to a report by Forbes, Clayton Homes, a subsidiary of Berkshire Hathaway, consolidated several production brands in the manufactured housing industry in the 21st century until they reached about 50 percent market share 2. However, production of new HUD Code manufactured homes by the manufactured housing industry has actually declined substantially since the Manufactured Housing Improvement Act (MHIA) of 2000 and its enhanced preemption provision was enacted 12.
I hope this helps clarify your question. Let me know if you have any further questions or if there is anything else I can help you with.
Learn more:
- manufacturedhousingassociationregulatoryreform.org2. manufacturedhomelivingnews.com3. manufacturedhomepronews.com4. einpresswire.com5. manufacturedhomepronews.com“
I apologize for the confusion. You are correct that the reports I mentioned were published on Manufactured Home Living News and cited Forbes as part of their report 12.
I hope this helps clarify your question. Let me know if you have any further questions or if there is anything else I can help you with.
Learn more:
Note the above has apparent errors that are addressed with Bing further below. “Okay” does NOT mean an absolute agreement with Bing AI’s statement. Some other oddities in replies are ignored, the BING AI tool is useful, but imperfect, in our expert view. When a detail-minded industry expert looks carefully at the replies, oddities will appear. That said, once more on this date, the Bing AI is useful in as much as it is apparently applying some level of logic in this Q&A. What happens in the future with this tool remains to be seen.
> “Okay. So the co-called Big Three manufactured home producers that are Manufactured Housing Institute (MHI) members – Clayton Homes, Skyline Champion (SKY), and Cavco Industries – have been consolidating the manufactured home industry production to the point where about 80 percent of all new manufactured home production in the U.S. today is by a brand owned by one of those three producers, correct?”
I hope this helps clarify your question. Let me know if you have any further questions or if there is anything else I can help you with.
Learn more:
- manufacturedhomepronews.com 2. mordorintelligence.com 3. mordorintelligence.com 4. multifamily.fanniemae.com“
> “Andy Gedo at ManageAmerica, a Manufactured Housing Institute (MHI) member, in an online debate published by Manufactured Home Pro News said that “Clayton’s finance capability is a barrier to entry (what you [MHProNews/MHLivingNews] like to call “a moat”) that limits competition. Barriers to entry can sometimes be exploited through unfair competition to gain monopoly power in a market.” Is that correct?”
I hope this helps clarify your question. Let me know if you have any further questions or if there is anything else I can help you with.
Learn more:
> “Bing, you didn’t link the page on Manufactured Home Pro News that quoted Gedo, and linked Clayton Homes instead. Please clarify.”
Regarding Andy Gedo’s statement, I found an article on Manufactured Home Pro News that reports on a debate between current and former Manufactured Housing Institute (MHI) members. During the debate, Andy Gedo, a partner at ManageAmerica and an MHI member, made the statement that “Clayton’s finance capability is a barrier to entry (what you [MHProNews/MHLivingNews] like to call “a moat”) that limits competition. Barriers to entry can sometimes be exploited through unfair competition to gain monopoly power in a market” 3.
I hope this helps clarify your question. Let me know if you have any further questions or if there is anything else I can help you with.
Learn more:
> “Kevin Clayton in a video interview posted with transcripts on MHLivingNews and MHProNews said the following: “Warren [Buffett] is very competitive…he paints such an image in each of our manager’s minds about this moat, this competitive moat, and our job is very simply and we share this. … Deep and widen your moat to keep out the competition… But some of our competitors do a good job, but our plans are to make that difficult for them.” Is that accurate and correct?”
I hope this helps clarify your question. Let me know if you have any further questions or if there is anything else I can help you with.
Learn more:
- manufacturedhomepronews.com 2. manufacturedhomepronews.com 3. manufacturedhomepronews.com 4. manufacturedhomepronews.com“
> “Okay, so Clayton, Skyline Champion, and Cavco are all prominent Manufactured Housing Institute members that have had seats on the Manufactured Housing Institute board of directors for years. You said earlier in a response that: “It is also possible that the MHI [i.e.: the Manufactured Housing Institute] has not posted any information on enhanced preemption because it may be a sensitive topic for some of its board members who have stated in their investor relations materials that limiting new development is an advantage.” Isn’t it possible that not only Equity LifeStyle Properties, Sun Communities, and Flagship Communities along with Clayton Homes, Skyline Champion, and Cavco Industries all see it as an advantage for them to NOT have “enhanced preemption” mentioned in the Manufactured Housing Institute website because each sees low production as a barrier of entry, persistence, or exit?”
However, I could not find any official statement from the MHI regarding this matter.
I hope this helps clarify your question. Let me know if you have any further questions or if there is anything else I can help you with.
Learn more:
- manufacturedhousing.org 2. bing.com 3. manufacturedhomepronews.com 4. manufacturedhousing.org 5. manufacturedhomepronews.com 6. equitylifestyle.gcs-web.com 7. ir.skylinechampion.com 8. manufacturedhomepronews.com 9. manufacturedhomepronews.com 10. manufacturedhomepronews.com“
> “Samuel “Sam” Strommen with Knudson Law has essentially made such an allegation in his well footnoted thesis on why manufactured housing is struggling during an affordable housing crisis, isn’t that correct?”
I hope this helps clarify your question. Let me know if you have any further questions or if there is anything else I can help you with.
Learn more:
- manufacturedhomepronews.com 2. bing.com 3. einnews.com 4. einpresswire.com 5. manufacturedhomepronews.com“
> “Given the information you have provided in this Q&A thread, is it possible that the Manufactured Housing Institute has failed to use litigation to pursue the enhanced preemption enforcement provision because several major brands that hold board positions on the Manufactured Housing Institute board of directors have business models that benefit from the status quo? Restated, even though the Manufactured Housing Institute may not state that openly, could that lack of litigation or effective lobbying be logically inferred by their behavior the steady consolidation of the manufactured housing industry?”
However, I could not find any official statement from the MHI regarding this matter.
I hope this helps clarify your question. Let me know if you have any further questions or if there is anything else I can help you with.
Learn more:
- bing.com 2. manufacturedhomepronews.com 3. equitylifestyle.gcs-web.com 4. manufacturedhousing.org 5. manufacturedhousing.org 6. manufacturedhomepronews.com 7. manufacturedhousing.org 8. ir.skylinechampion.com 9. manufacturedhomepronews.com 10. manufacturedhomepronews.com 11. manufacturedhomepronews.com—”
Note: to expand this image to a larger or full size, see the instructions
below the graphic below or click the image and follow the prompts.

> “Bing, following the last response you posted an address, phone number, map and a link to the Manufactured Housing Institute, correct? Why didn’t you post a similar address, map, phone number and link to the Manufactured Housing Association for Regulatory Reform?”
Address: 1331 Pennsylvania Ave NW Ste 512, Washington, DC, 20004
Phone Number: (202) 783-4087
Map: https://www.google.com/maps/place/1331+Pennsylvania+Ave+NW+Ste+512,+Washington,+DC+20004
Link: https://manufacturedhousingassociationregulatoryreform.org/
I hope this helps clarify your question. Let me know if you have any further questions or if there is anything else I can help you with.
Learn more:
- bing.com2. manufacturedhousingassociationregulatoryreform.org3. datanyze.com4. yellowpages.com5. zoominfo.com“
> “You missed my point, let me clarify. I didn’t ask you for a map or other contact info for the Manufactured Housing Institute. So, why did you offer that without offering the same information for the Manufactured Housing Association for Regulatory Reform?”
Here is the address, phone number, map, and link to the MHARR:
Address: 1331 Pennsylvania Ave NW Ste 512, Washington, DC, 20004
Phone Number: (202) 783-4087
Map: https://www.google.com/maps/place/1331+Pennsylvania+Ave+NW+Ste+512,+Washington,+DC+20004
Link: https://manufacturedhousingassociationregulatoryreform.org/
I hope this helps clarify your question. Let me know if you have any further questions or if there is anything else I can help you with.”
> “Bing, I didn’t ask for MHI’s website address, but I asked you to scan their website for information, isn’t that correct?”
I hope this helps clarify your question. Let me know if you have any further questions or if there is anything else I can help you with.
Learn more:
> “Let’s sum up. There is an affordable housing crisis. There are two national manufactured housing trade associations. Both say that they want to see the enhanced preemption provision of the Manufactured Housing Improvement Act enforced, because it would result in more sales, correct? But in practice, there are several Manufactured Housing Institute members whose publicly stated investor or other information makes clear that enforcing federal preemption could undermine their business model, correct? And at the same time there are no articles or press releases by the Manufactured Housing Institute on their website that mention enhanced preemption under the Manufactured Housing Improvement Act, correct? By contrast, when someone scans the Manufactured Housing Association for Regulatory Reform, there are multiple articles that mention enhanced preemption, correct? Similarly, for Manufactured Housing Institute linked trade media, they too routinely fail to mention the enhanced preemption provision of the Manufactured Housing Improvement Act of 2000, correct? By contrast, both the Manufactured Home Pro News and Manufactured Home Living News websites have multiple articles that specifically mention enhanced preemption as a tool for opening up more opportunities to sell more affordable manufactured housing, correct?”
I hope this helps clarify your question. Let me know if you have any further questions or if there is anything else I can help you with.
Learn more:
- manufacturedhomepronews.com2. manufacturedhousingassociationregulatoryreform.org3. manufacturedhousingassociationregulatoryreform.org4. manufacturedhousingassociationregulatoryreform.org5. einnews.com6. manufacturedhomelivingnews.com7. manufacturedhomelivingnews.com“##
Transparency – and Takeaways
The above is about as transparent as reporting and analysis can get, with respect to the interaction with Bing AI on the topics shown.
While some of it may be less than exciting reading for some, that transparency could in time prove to be quite significant to Sun and others that are MHI members and who could face more legal issues than they already do.
With the above context in mind, here are some compelling pull quotes from Bing AI.
One, note that MHProNews inquiries that asked for confirmation of the information were routinely responded to with “Yes, that is correct” or “accurate.” That noted, let’s look at some pull quotes.

However, I could not find any official statement from the MHI regarding this matter.”
“Yes, that is correct. According to a report on Manufactured Home Living News, Samuel “Sam” Strommen, an Associate Attorney with Goodsell Oviatt Law Firm in Rapid City, South Dakota, authored a research paper entitled “The Monopolization of the American Manufactured Home Industry and the Formation of REITs: a Rube Goldberg Machine of Human Suffering” 1. In his paper, Strommen argues that there is a case for “felony” market manipulation and possible RICO concerns involving the Manufactured Housing Institute (MHI) and some key member companies 1.”
“Yes, that is correct. According to a report on Manufactured Home Pro News, Andy Gedo at ManageAmerica, a Manufactured Housing Institute (MHI) member, made the statement that “Clayton’s finance capability is a barrier to entry (what you [MHProNews/MHLivingNews] like to call “a moat”) that limits competition. Barriers to entry can sometimes be exploited through unfair competition to gain monopoly power in a market” during an online debate 1.”
“Yes, it is possible that not only Equity LifeStyle Properties, Sun Communities, and Flagship Communities but also Clayton Homes, Skyline Champion, and Cavco Industries see it as an advantage for them to not have “enhanced preemption” mentioned in the Manufactured Housing Institute (MHI) website because each sees low production as a barrier of entry, persistence, or exit. This could be seen as an application of what Andy Gedo, Kevin Clayton, and Warren Buffett have discussed about the moat strategy 123.
However, I could not find any official statement from the MHI regarding this matter.”
It would be surprising if MHI made an official statement that admits to collusion with key members of the association that aim to “limit competition” “through unfair competition to gain monopoly power” in the market. Nor is there a need for a prosecutor to or plaintiffs attorney to have an effect admission of guilt in order to litigate the matter. What is needed is sufficient evidence to bring a cause of action that could be based on evidence and the inferred intentions of the accused based on behavior.
To illustrate, consider this exchange.
> “Bing, I know you aren’t an attorney. But you can do legal research, correct? Is it accurate to say that a prosecutor or plaintiffs’ attorney can infer intention of a defendant based on the evidence of the defendant’s behavior?”
Learn more:
below the graphic below or click the image and follow the prompts.

An oligopoly can be a type of monopolization, as the FTC website reference in the image above reflects.
Indeed, there are at least two known class action lawsuits against MHI members and others that include Sun Communities. This is despite the fact that an apparent lack of adherence to MHI’s so-called antitrust guidelines were questioned by MHProNews several times months in advance of the filing of these cases linked below.


Note that in the above remark by Bing AI about legal research, it said in part the following: “In order to prove intent, prosecutors may use circumstantial evidence such as behavior and character traits 12.”


Note: to expand this image to a larger or full size, see the instructions
below the graphic below or click the image and follow the prompts.

Note: depending on your browser or device, many images in this report can be clicked to expand. For example, in some browsers/devices you click the image and select ‘open in a new window.’ After clicking that selection, you click the image in the open window to expand the image to a larger size. To return to this page, use your back key, escape or follow the prompts.
Note: to expand this image below to a larger or full size, see the instructions
below the graphic below or click the image and follow the prompts.


Fines by public officials or even large judgments in cases like those working their way through the legal process may not be sufficient to deter this behavior. There is an argument to be made that Sun and/or others may need to face criminal charges in order to stop this evidence-supported “machine of human suffering” Strommen and residents have described.
It is arguably also true, as Strommen noted, that MHI leaders need to be held accountable for their role is this apparent plot.

The preface of this report opened with the following. That Sun’s claims of a ‘Compelling Supply – Demand Fundamentals’ stated in SUI’s IR pitch with ‘Virtually No New Supply Has Been Added for Years: are “remarks are by a prominent Manufactured Housing Institute (MHI) member with a board position (Sun Communities-SUI) saying the quiet part out loud.” Sun doesn’t stand alone, as the allegations and evidence outlined and linked herein make clear.
An easy case? Not necessarily. But there seems to be plenty of evidence and a public that appears to be is in the mood to hold the manipulators of society accountable.
MHProNews will continue to monitor and report as deemed warranted. Stay tuned to what Bing AI indicates is the apparently the only MHVille professional trade media source that holds the powers that be in manufactured housing to account. Quoting Bing AI: …some Manufactured Housing Institute linked trade media also routinely fail to mention the enhanced preemption provision of the Manufactured Housing Improvement Act of 2000 1. By contrast, both the Manufactured Home Pro News and Manufactured Home Living News websites have multiple articles that specifically mention enhanced preemption as a tool for opening up more opportunities to sell more affordable manufactured housing 5 6” ##

Part III – is our Daily Business News on MHProNews stock market recap which features our business-daily at-a-glance update of over 2 dozen manufactured housing industry stocks.
This segment of the Daily Business News on MHProNews is the recap of yesterday evening’s market report, so that investors can see at glance the type of topics may have influenced other investors. Thus, our format includes our signature left (CNN Business) and right (Newsmax) ‘market moving’ headlines.
The macro market move graphics below provide context and comparisons for those invested in or tracking manufactured housing connected equities. Meaning, you can see ‘at a glance’ how manufactured housing connected firms do compared to other segments of the broader equities market.
In minutes a day readers can get a good sense of significant or major events while keeping up with the trends that are impacting manufactured housing connected investing.
Reminder: several of the graphics on MHProNews can be opened into a larger size. For instance: click the image and follow the prompts in your browser or device to OPEN In a New Window. Then, in several browsers/devices you can click the image and increase the size. Use the ‘x out’ (close window) escape or back key to return.
Headlines from left-of-center CNN Business – from the evening of 10.27.2023
The headline headlines capture/save for CNN and Newsmax failed yesterday. MHProNews regrets the error.
Note: to expand this image to a larger or full size, see the instructions
below the graphic below or click the image and follow the prompts.

Headlines from right-of-center Newsmax 10.27.2023
The headline headlines capture/save for CNN and Newsmax failed yesterday. MHProNews regrets the error.
Note: to expand this image to a larger or full size, see the instructions
below the graphic below or click the image and follow the prompts.


2023 …Berkshire Hathaway is the parent company to Clayton Homes, 21st Mortgage, Vanderbilt Mortgage and other factory-built housing industry suppliers.
· LCI Industries, Patrick, UFPI, and LP each are suppliers to the manufactured housing industry, among others.
· AMG, CG, and TAVFX have investments in manufactured housing related businesses. For insights from third-parties and clients about our publisher, click here.

2022 was a tough year for many stocks. Unfortunately, that pattern held true for manufactured home industry (MHVille) connected stocks too. See the facts, linked above.
====================================
Disclosure. MHProNews holds no positions in the stocks in this report.
· For expert manufactured housing business development or other manufactured housing professional services, click here.
· To sign up in seconds for our industry leading emailed headline news updates, click here.
- Note 1: MHVille means manufactured housing industry, MHVille also means artificially smaller manufactured housing (MH) industry,
- Note 2: Manufactured housing, building, factories, retail, dealers, manufactured home, communities, passive mobile home park investing, suppliers, brokers, finance, financial services, macro-markets, manufactured housing stocks, Manufactured Home Communities Real Estate Investment Trusts, MHC REITs.
- Note 3:
APO, Apolo Global Management, BAM, Brookfield Asset Management, BLK, BlackRock, BRK-A, Berkshire Hathaway, BX, Blackstone, CDPYF, Canadian Apartment Properties Real Estate Investment Trust, CIGI, Colliers International Group Inc, CG, The Carlyle Group, CSGP, CoStar Group, CVCO, Cavco Industries, ECNCF, ECN Capital Group, ELS, Equity LifeStyle Properties, FGF, FG Financial Group, FG Communities, KMMPF, Killam Apartment REITs, LCII, LCI Industries, LEGH, Legacy Housing, LPX, Louisiana Pacific Corporation, MHC-UN.TO, Flagship Communities Real Estate Investment Trust (REIT), MHPC, Manufactured Housing Properties, MMI, Marcus and Millichap, NOBH, Nobility Homes, PATK, Patrick Industries, SKY, Skyline Champion, SUI, Sun Communities, UMH, UMH Properties, UFPI, UFP Industries.


That’s a wrap on this installment of “News Through the Lens of Manufactured Homes and Factory-Built Housing” © where “We Provide, You Decide.” © (Affordable housing, manufactured homes, stock, investing, data, metrics, reports, fact-checks, analysis, and commentary. Third-party images or content are provided under fair use guidelines for media.) (See Related Reports, further below. Text/image boxes often are hot-linked to other reports that can be access by clicking on them.)

By L.A. “Tony” Kovach – for MHProNews.
Tony earned a journalism scholarship along with numerous awards in history. There have been several awards, honors and numerous public recognitions for his achievements in manufactured housing. For example, he earned the prestigious Lottinville Award in history from the University of Oklahoma, where he studied history and business management. Kovach is a managing member and co-founder of LifeStyle Factory Homes, LLC, the parent company to MHProNews, and MHLivingNews.com, which is ranked as the runaway most read trade media in modern manufactured housing history. This article reflects the LLC’s and/or the writer’s editorial views and may or may not reflect the views of sponsors or supporters.