“The widened bid/ask spread and restrictive lending environment severely hindered trading and financing volumes during the second quarter,” said Hessam Nadji, president and chief executive officer [of Marcus and Millichap],” per their media release, provided herein below. In a separate document focused on manufactured home communities for the first half of 2023, Marcus and Millichap said: “A broad-based housing shortage has caused rising home costs, including for manufactured homes.” “Low vacancy places pressure on rents. Manufactured housing lot development has not kept pace with consumer demand. Local zoning restrictions and a general preference for other land uses often create barriers to the development of new manufactured home communities, making development a lengthy process.” So, what is this operation that produced these and other interesting statements, facts, and remarks provided below? “Marcus & Millichap, Inc. [MMI] is an American company that provides real estate brokerage, mortgage brokerage, research, and advisory services in the U.S. and Canada in the field of commercial property. It popularized the practice of listing properties exclusively with one brokerage firm.” So said left-leaning Wikipedia. MMI has been listed as a member of the Manufactured Housing Institute (MHI), perhaps that is no surprise. Marcus and Millichap (MMI) recently released its quarterly financial requests AND they also have released their most recent snapshot of the manufactured home community market research.
As a cautionary note on MMI’s research on manufactured housing and manufactured home communities, one statement is quite obviously dated and demonstrably inaccurate. “Manufactured Home Shipments on the Rise.” That may have been true at times in 2020, 2021, and through parts of 2022. But as MHProNews has reported using data from informed sources, by the last quarter of 2022, manufactured home production began to sag – not rise – as orders to HUD Code manufactured housing factories dropped. New shipments of manufactured homes in 2023 have been in a steep decline. More on that production decline and other industry insights, pro and con, with respect to MMI’s research is linked here and further below in Part III.
- In Part I of this report will be the MMI’s media release via Berkshire Hathaway owned BusinessWire, and picked up by financial and news outlets like Yahoo. As that press release presents MMI’s performance, it appears successful in several respects.
- In Part II of this report will be MMI’s 1st Half of 2023 research report on manufactured home communities (MHCs).
- Part III will provide additional information with more MHProNews analysis and commentary. For thousands of industry professionals, reporting and unpacking third-party research are but one of many features that keeps professionals coming to the manufactured housing industry’s #1 source for fact and evidence-based manufactured home “Industry News, Tips, and Views Pros Can Use.” ©
With that outline for this report, analysis and industry expert commentary, let’s dive into the insights to be learned and/or confirmed from the following.
Part I
Marcus & Millichap, Inc. Reports Results for Second Quarter 2023
CALABASAS, Calif., August 04, 2023–(BUSINESS WIRE)–Marcus & Millichap, Inc. (the “Company”, “Marcus & Millichap”, or “MMI”) (NYSE: MMI), a leading national brokerage firm specializing in commercial real estate investment sales, financing, research and advisory services, today reported its second quarter results.
Second Quarter 2023 Highlights Compared to Second Quarter 2022
- Total revenue of $162.9 million decreased 58.9%, a difficult comparable to a record second quarter 2022 where revenue was up 39.0% compared to second quarter 2021
- Brokerage commissions of $140.3 million decreased 60.4% compared to second quarter 2022, which was up 40.2% compared to second quarter 2021
- Private Client Market brokerage revenue of $96.2 million decreased 54.1% compared to second quarter 2022, which was up 32.7% compared to second quarter 2021
- Middle Market and Larger Transaction Market brokerage revenue of $39.4 million decreased 71.5% compared to second quarter 2022, which was up 58.5% compared to second quarter 2021
- Financing fees of $17.9 million decreased 51.4% compared to second quarter 2022, which was up 30.5% compared to second quarter 2021
- Net loss of $8.7 million, or $0.23 per common share, diluted, compared to net income of $42.2 million, or $1.04 per common share, diluted
- Earnings were impacted by expenses related to growth initiatives, including talent acquisition and retention
- Adjusted EBITDA of $(1.1) million, compared to $62.9 million
Six Months 2023 Highlights Compared to Six Months 2022
- Total revenue of $317.7 million decreased 55.6%, a difficult comparable to a record first half 2022 where revenue was up 52.6% compared to first half 2021
- Brokerage commissions of $275.4 million decreased 57.1% compared to first half 2022, which was up 54.3% compared to first half 2021
- Private Client Market brokerage revenue of $186.7 million decreased 49.7% compared to first half 2022, which was up 40.7% compared to first half 2021
- Middle Market and Larger Transaction Market brokerage revenue of $78.9 million decreased 69.4% compared to first half 2022, which was up 86.6% compared to first half 2021
- Financing fees of $33.8 million decreased 46.6% compared to first half 2022, which was up 37.4% compared to first half 2021
- Net loss of $14.6 million, or $0.37 per common share, diluted, compared to net income of $75.0 million, or $1.85 per common share, diluted
- Earnings were impacted by expenses related to growth initiatives, including talent acquisition and retention
- Adjusted EBITDA of $(8.5) million, compared to $114.8 million
“The widened bid/ask spread and restrictive lending environment severely hindered trading and financing volumes during the second quarter,” said Hessam Nadji, president and chief executive officer. “Our results reflected this challenging market as well as the comparative effect of our outsized growth in the second quarter of 2022, which marked the second highest revenue quarter in our history. Our strategy, shaped by our playbook of perseverance through multiple cycles in our 52-year history, is unwavering. This includes doubling-down on client outreach, retaining and supporting our sales force, investing in proprietary technology, expanding our sales force and pursuing strategic acquisitions,” he added. “We are confident that the combination of these initiatives, all of which moved forward as planned during the quarter, will position MMI to accelerate growth in the recovery and beyond.”
Mr. Nadji continued, “We are seeing record amounts of capital on the sidelines as evidenced by multiple offers in transactions that are priced appropriately for today’s market. We are encouraged by progress on bringing down inflation and the Fed’s tightening cycle nearing its end, which should lead to gradual improvements in market conditions. Although it is difficult to forecast the timing for a full-scale recovery in trading volumes, we remain focused on further growing the brand and enhancing the MMI platform. Moreover, we continue to return capital to shareholders in the form of dividends and share repurchases. With this balanced approach we are able to take full advantage of the market dislocation to further enhance our competitive position and be well positioned to deliver long-term value for our shareholders.”
Second Quarter 2023 Results Compared to Second Quarter 2022
Total revenue for the second quarter 2023 was $162.9 million, a decrease of 58.9% compared to $396.0 million for the second quarter 2022, which was up 39.0% compared to the second quarter 2021. The record revenue of second quarter 2022 provides for a difficult comparison with the second quarter 2023.
For real estate brokerage commissions, the average transaction size and the average commission per transaction decreased by 28.3% and 25.3%, respectively, compared to the second quarter 2022. The number of transactions decreased by 47.0%, reducing real estate brokerage commissions to $140.3 million, a 60.4% reduction from the same period in the prior year, which increased 40.2% over the second quarter 2021. Compared to the second quarter 2022, Private Client Market revenue decreased by 54.1%, and the combined Middle Market and Larger Transaction Market revenue decreased by 71.5%, while the second quarter 2022 increased by 32.7% and 58.5%, respectively, compared to the second quarter 2021.
Financing activity experienced an increase in the average fee per transaction by 16.0%, while the average transaction size and the number of transactions decreased by 10.3% and 59.3%, respectively, resulting in a decrease in financing fees to $17.9 million, a 51.4% reduction from the same period in the prior year, which increased 30.5% compared to the same period in 2021.
Total operating expenses for the second quarter 2023 were $173.5 million, compared to $339.2 million for the same period in the prior year. The change was primarily due to reductions of 60.5% in cost of services and 13.7% in selling, general and administrative expenses. Cost of services as a percentage of total revenue decreased by 260 basis points to 62.1% compared to the same period during the prior year.
Selling, general and administrative expenses for the second quarter 2023 were $68.9 million, compared to $79.8 million, in the same period in 2022. The change was primarily due to a reduction in compensation-related costs, specifically performance-based bonuses for the second quarter 2023, partially offset by an increased investment in business development, marketing and other support related to the long-term talent acquisition and retention of sales and financing professionals.
Net loss for the second quarter 2023 was $8.7 million, or $0.23 per common share, diluted, compared to net income of $42.2 million, or $1.04 per common share, diluted, for the same period in 2022. In the second quarter 2022, net income was up 33.7% from the second quarter 2021. Adjusted EBITDA for the second quarter 2023 was $(1.1) million, compared to $62.9 million for the same period in the prior year, primarily as a result of the decrease in operating income.
Six Months 2023 Results Compared to Six Months 2022
Total revenues for the six months ended June 30, 2023 were $317.7 million, compared to $715.4 million for the same period in the prior year, a decrease of $397.8 million, or 55.6%. Total operating expenses for the six months ended June 30, 2023 decreased by 43.9% to $344.4 million compared to $614.4 million for the same period in the prior year. Cost of services as a percent of total revenues decreased to 61.9%, down 140 basis points compared to the first six months of 2022. The Company’s net loss for the six months ended June 30, 2023 was $14.6 million, or $0.37 per common share, diluted, compared to net income of $75.0 million, or $1.85 per common share, diluted, for the same period in the prior year. Adjusted EBITDA for the six months ended June 30, 2023 decreased to $(8.5) million, from $114.8 million for the same period in the prior year. As of June 30, 2023, the Company had 1,865 investment sales and financing professionals, 36 fewer than the prior year.
Capital Allocation
On August 1, 2023, the Board of Directors declared a semi-annual regular dividend of $0.25 per share, payable on October 6, 2023, to stockholders of record at the close of business on September 15, 2023.
During the six months ended June 30, 2023, the Company repurchased 1,098,561 shares of common stock at an average price of $31.28 per share for a total price of $34.4 million.
After accounting for shares repurchased through August 1, 2023, Marcus & Millichap has approximately $76.0 million available to repurchase shares under its program. No time limit has been established for the completion of the program, and the repurchases are expected to be executed from time-to-time, subject to general business and market conditions and other investment opportunities, through open market purchases or privately negotiated transactions, including through Rule 10b5-1 plans.
Business Outlook
The economy and commercial real estate transaction market are expected to remain choppy through the third quarter of 2023 as higher interest rates and lender caution lengthen the price discovery process and the buyer/seller expectation gap remains wide. However, the Company believes it remains well positioned to achieve long-term growth.
The Company benefits from its experienced management team, infrastructure investments, industry-leading market research and proprietary technology. The size and fragmentation of the Private Client Market segment continues to offer long-term growth opportunities through consolidation. This highly fragmented market segment consistently accounts for over 80% of all commercial property sales transactions and over 60% of the commission pool. The top 10 brokerage firms led by MMI have an estimated 20% share of this segment by transaction count.
Key factors that may influence the Company’s business during the remainder of 2023 include:
- Volatility in market sales and investor sentiment driven by:
- The elevated cost and availability of debt capital
- Higher interest rate fluctuations and the heightened bid-ask spread between buyers and sellers
- Risks of potential recession and the resulting reduction of CRE space demand that results from uncertainty
- Possible impact to investor sentiment related to potential tax and other policy changes which may contribute to transaction acceleration and/or future fluctuations in sales and financing activity
- Rising operating costs driven by wages, insurance, taxes and construction materials
- Volatility in each of the Company’s market segments
- Increase in costs related to in-person events, client meetings, and conferences
- Global geopolitical uncertainty, which may cause investors to refrain from transacting
- The potential for acquisition activity and subsequent integration
Webcast and Call Information
Marcus & Millichap will host a live webcast today to discuss the financial results at 7:30 a.m. Pacific Time/10:30 a.m. Eastern Time. The webcast will be accessible through the Investor Relations section of Marcus & Millichap’s website at ir.marcusmillichap.com and will be archived upon completion of the call. The Company encourages the use of the webcast due to potential extended wait times to access the conference call via dial-in.
For those unable to access the webcast, callers from the United States and Canada should dial 1-877-407-9208 ten minutes prior to the scheduled call time. International callers should dial 1-201-493-6784.
Replay Information
For those unable to participate during the live broadcast, a telephonic replay of the call will also be available from 1:30 p.m. Eastern Time on Friday, August 4, 2023 through 11:59 p.m. Eastern Time on Friday, August 18, 2023 by dialing 1-844-512-2921 in the United States and Canada or 1-412-317-6671 internationally and entering passcode 13739665.
About Marcus & Millichap, Inc.
Marcus & Millichap, Inc. is a leading national brokerage firm specializing in commercial real estate investment sales, financing, research and advisory services. As of June 30, 2023, the Company had 1,865 investment sales and financing professionals in 80 offices who provide investment brokerage and financing services to sellers and buyers of commercial real estate. The Company also offers market research, consulting and advisory services to our clients. Marcus & Millichap closed 3,753 transactions during the six months ended June 30, 2023, with a sales volume of $20.2 billion. For additional information, please visit www.MarcusMillichap.com.
SPECIAL NOTE REGARDING FORWARD-LOOKING STATEMENTS
This release includes forward-looking statements, including the Company’s business outlook for 2023, the anticipation of further interest rate increases and inflation, the execution of our capital return program, and expectations for market share growth. We have based these forward-looking statements largely on our current expectations and projections about future events and financial trends affecting the financial condition of our business. Forward-looking statements should not be read as a guarantee of future performance or results and will not necessarily be accurate indications of the times at, or by, which such performance or results may be achieved. Forward-looking statements are based on information available at the time those statements are made and/or management’s good faith belief as of that time with respect to future events and are subject to risks and uncertainties that could cause actual performance or results to differ materially from those expressed in or suggested by the forward-looking statements. Important factors that could cause such differences include, but are not limited to:
- general uncertainty in the capital markets, a worsening of economic conditions, and the rate and pace of economic recovery following an economic downturn;
- changes in our business operations;
- market trends in the commercial real estate market or the general economy, including the impact of rising inflation and higher interest rates;
- our ability to attract and retain qualified senior executives, managers and investment sales and financing professionals;
- the effects of increased competition on our business;
- our ability to successfully enter new markets or increase our market share;
- our ability to successfully expand our services and businesses and to manage any such expansions;
- our ability to retain existing clients and develop new clients;
- our ability to keep pace with changes in technology;
- any business interruption or technology failure, including cyber and ransomware attacks, and any related impact on our reputation;
- changes in interest rates, availability of capital, tax laws, employment laws or other government regulation affecting our business;
- our ability to successfully identify, negotiate, execute and integrate accretive acquisitions; and
- other risk factors included under “Risk Factors” in our most recent Annual Report on Form 10-K and Quarterly Report on Form 10-Q.
In addition, in this release, the words “believe,” “may,” “will,” “estimate,” “continue,” “anticipate,” “intend,” “goal,” “expect,” “predict,” “potential,” “should” and similar expressions, as they relate to our Company, our business and our management, are intended to identify forward-looking statements. In light of these risks and uncertainties, the forward-looking events and circumstances discussed in this release may not occur and actual results could differ materially from those anticipated or implied in the forward-looking statements.
Forward-looking statements speak only as of the date of this release. You should not put undue reliance on any forward-looking statements. We assume no obligation to update forward-looking statements to reflect actual results, changes in assumptions or changes in other factors affecting forward-looking information, except to the extent required by applicable laws. If we update one or more forward-looking statements, no inference should be drawn that we will make additional updates with respect to those or other forward-looking statements. We have not filed our Form 10-Q for the quarter ended June 30, 2023. As a result, all financial results described in this earnings release should be considered preliminary, and are subject to change to reflect any necessary adjustments or changes in accounting estimates, that are identified prior to the time we file our Form 10-Q.
| MARCUS & MILLICHAP, INC. | ||||||||||||||||
| CONDENSED CONSOLIDATED STATEMENTS OF OPERATIONS | ||||||||||||||||
| (in thousands, except per share amounts) | ||||||||||||||||
| (Unaudited) | ||||||||||||||||
| Three Months Ended June 30, |
Six Months Ended June 30, |
|||||||||||||||
| 2023 | 2022 | 2023 | 2022 | |||||||||||||
| Revenue: | ||||||||||||||||
| Real estate brokerage commissions | $ | 140,330 | $ | 354,685 | $ | 275,376 | $ | 641,594 | ||||||||
| Financing fees | 17,896 | 36,811 | 33,764 | 63,264 | ||||||||||||
| Other revenue | 4,640 | 4,461 | 8,518 | 10,563 | ||||||||||||
| Total revenue | 162,866 | 395,957 | 317,658 | 715,421 | ||||||||||||
| Operating expenses: | ||||||||||||||||
| Cost of services | 101,163 | 256,042 | 196,590 | 452,810 | ||||||||||||
| Selling, general and administrative | 68,910 | 79,841 | 141,129 | 154,376 | ||||||||||||
| Depreciation and amortization | 3,468 | 3,332 | 6,675 | 7,243 | ||||||||||||
| Total operating expenses | 173,541 | 339,215 | 344,394 | 614,429 | ||||||||||||
| Operating (loss) income | (10,675 | ) | 56,742 | (26,736 | ) | 100,992 | ||||||||||
| Other income (expense), net | 4,890 | (461 | ) | 9,700 | (11 | ) | ||||||||||
| Interest expense | (216 | ) | (158 | ) | (431 | ) | (318 | ) | ||||||||
| (Loss) income before provision (benefit) for income taxes | (6,001 | ) | 56,123 | (17,467 | ) | 100,663 | ||||||||||
| Provision (benefit) for income taxes | 2,728 | 13,955 | (2,905 | ) | 25,712 | |||||||||||
| Net (loss) income | $ | (8,729 | ) | $ | 42,168 | $ | (14,562 | ) | $ | 74,951 | ||||||
| (Loss) earnings per share: | ||||||||||||||||
| Basic | $ | (0.23 | ) | $ | 1.05 | $ | (0.37 | ) | $ | 1.87 | ||||||
| Diluted | $ | (0.23 | ) | $ | 1.04 | $ | (0.37 | ) | $ | 1.85 | ||||||
| Weighted average common shares outstanding: | ||||||||||||||||
| Basic | 38,538 | 40,048 | 38,867 | 40,018 | ||||||||||||
| Diluted | 38,538 | 40,342 | 38,867 | 40,390 | ||||||||||||
MARCUS & MILLICHAP, INC.
KEY OPERATING METRICS SUMMARY
(Unaudited)
Total sales volume was approximately $9.7 billion for the three months ended June 30, 2023, encompassing 1,946 transactions consisting of $7.5 billion for real estate brokerage (1,422 transactions), $1.6 billion for financing (284 transactions) and $0.6 billion in other transactions, including consulting and advisory services (240 transactions). Total sales volume was $20.2 billion for the six months ended June 30, 2023, encompassing 3,753 transactions consisting of $14.7 billion for real estate brokerage (2,701 transactions), $3.4 billion for financing (563 transactions) and $2.1 billion in other transactions, including consulting and advisory services (489 transactions). As of June 30, 2023, the Company had 1,768 investment sales professionals and 97 financing professionals. Key metrics for real estate brokerage and financing activities (excluding other transactions) are as follows:
| Three Months Ended June 30, |
Six Months Ended June 30, |
||||||||||||||||||||
| Real Estate Brokerage | 2023 | 2022 | 2023 | 2022 | |||||||||||||||||
| Average Number of Investment Sales Professionals | 1,757 | 1,822 | 1,769 | 1,839 | |||||||||||||||||
| Average Number of Transactions per Investment Sales Professional | 0.81 | 1.47 | 1.53 | 2.62 | |||||||||||||||||
| Average Commission per Transaction | $ | 98,686 | $ | 132,099 | $ | 101,954 | $ | 133,056 | |||||||||||||
| Average Commission Rate | 1.86 | % | 1.79 | % | 1.88 | % | 1.73 | % | |||||||||||||
| Average Transaction Size (in thousands) | $ | 5,303 | $ | 7,399 | $ | 5,433 | $ | 7,688 | |||||||||||||
| Total Number of Transactions | 1,422 | 2,685 | 2,701 | 4,822 | |||||||||||||||||
| Total Sales Volume (in millions) | $ | 7,542 | $ | 19,868 | $ | 14,674 | $ | 37,073 | |||||||||||||
| Three Months Ended June 30, |
Six Months Ended June 30, |
||||||||||||||||||||
| Financing (1) | 2023 | 2022 | 2023 | 2022 | |||||||||||||||||
| Average Number of Financing Professionals | 95 | 87 | 94 | 86 | |||||||||||||||||
| Average Number of Transactions per Financing Professional | 2.99 | 8.01 | 5.99 | 14.15 | |||||||||||||||||
| Average Fee per Transaction | $ | 52,166 | $ | 44,985 | $ | 49,382 | $ | 44,198 | |||||||||||||
| Average Fee Rate | 0.90 | % | 0.70 | % | 0.82 | % | 0.75 | % | |||||||||||||
| Average Transaction Size (in thousands) | $ | 5,786 | $ | 6,453 | $ | 5,986 | $ | 5,882 | |||||||||||||
| Total Number of Transactions | 284 | 697 | 563 | 1,217 | |||||||||||||||||
| Total Financing Volume (in millions) | $ | 1,643 | $ | 4,498 | $ | 3,370 | $ | 7,158 | |||||||||||||
| (1) | Operating metrics exclude certain financing fees not directly associated to transactions. |
The following table sets forth the number of transactions, sales volume and revenue by commercial real estate market segment for real estate brokerage:
| Three Months Ended June 30, | |||||||||||||||||||||||||||
| 2023 | 2022 | Change | |||||||||||||||||||||||||
| Real Estate Brokerage | Number | Volume | Revenue | Number | Volume | Revenue | Number | Volume | Revenue | ||||||||||||||||||
| (in millions) | (in thousands) | (in millions) | (in thousands) | (in millions) | (in thousands) | ||||||||||||||||||||||
| <$1 million | 209 | $ | 120 | $ | 4,665 | 279 | $ | 168 | $ | 6,672 | (70 | ) | $ | (48 | ) | $ | (2,007 | ) | |||||||||
| Private Client Market ($1 – <$10 million) |
1,070 | 3,571 | 96,238 | 2,021 | 7,348 | 209,868 | (951 | ) | $ | (3,777 | ) | $ | (113,630 | ) | |||||||||||||
| Middle Market ($10 – <$20 million) |
77 | 1,021 | 17,425 | 209 | 2,819 | 56,456 | (132 | ) | $ | (1,798 | ) | $ | (39,031 | ) | |||||||||||||
| Larger Transaction Market (≥$20 million) |
66 | 2,830 | 22,002 | 176 | 9,533 | 81,689 | (110 | ) | $ | (6,703 | ) | $ | (59,687 | ) | |||||||||||||
| 1,422 | $ | 7,542 | $ | 140,330 | 2,685 | $ | 19,868 | $ | 354,685 | (1,263 | ) | $ | (12,326 | ) | $ | (214,355 | ) | ||||||||||
| Six Months Ended June 30, | |||||||||||||||||||||||||||
| 2023 | 2022 | Change | |||||||||||||||||||||||||
| Real Estate Brokerage | Number | Volume | Revenue | Number | Volume | Revenue | Number | Volume | Revenue | ||||||||||||||||||
| (in millions) | (in thousands) | (in millions) | (in thousands) | (in millions) | (in thousands) | ||||||||||||||||||||||
| <$1 million | 392 | $ | 236 | $ | 9,703 | 485 | $ | 296 | $ | 12,459 | (93 | ) | $ | (60 | ) | $ | (2,756 | ) | |||||||||
| Private Client Market ($1 – <$10 million) |
2,040 | 6,825 | 186,741 | 3,627 | 13,044 | 370,899 | (1,587 | ) | $ | (6,219 | ) | $ | (184,158 | ) | |||||||||||||
| Middle Market ($10 – <$20 million) |
143 | 1,921 | 34,793 | 393 | 5,322 | 103,216 | (250 | ) | $ | (3,401 | ) | $ | (68,423 | ) | |||||||||||||
| Larger Transaction Market (≥$20 million) |
126 | 5,692 | 44,139 | 317 | 18,411 | 155,020 | (191 | ) | $ | (12,719 | ) | $ | (110,881 | ) | |||||||||||||
| 2,701 | $ | 14,674 | $ | 275,376 | 4,822 | $ | 37,073 | $ | 641,594 | (2,121 | ) | $ | (22,399 | ) | $ | (366,218 | ) | ||||||||||
| MARCUS & MILLICHAP, INC. | ||||||||
| CONDENSED CONSOLIDATED BALANCE SHEETS | ||||||||
| (in thousands, except for shares and par value) | ||||||||
| June 30, 2023 (unaudited) |
December 31, 2022 |
|||||||
| Assets | ||||||||
| Current assets: | ||||||||
| Cash, cash equivalents, and restricted cash | $ | 171,220 | $ | 235,873 | ||||
| Commissions receivable | 9,954 | 8,453 | ||||||
| Prepaid expenses | 8,872 | 9,411 | ||||||
| Income tax receivable | 17,491 | 8,682 | ||||||
| Marketable debt securities, available-for-sale (amortized cost of $165,471 and $254,682 at June 30, 2023 and December 31, 2022, respectively, and $0 allowance for credit losses) | 164,856 | 253,434 | ||||||
| Advances and loans, net | 3,497 | 4,005 | ||||||
| Other assets, current | 5,850 | 7,282 | ||||||
| Total current assets | 381,740 | 527,140 | ||||||
| Property and equipment, net | 28,462 | 27,644 | ||||||
| Operating lease right-of-use assets, net | 102,741 | 87,945 | ||||||
| Marketable debt securities, available-for-sale (amortized cost of $74,758 and $72,819 at June 30, 2023 and December 31, 2022, respectively, and $0 allowance for credit losses) | 70,711 | 68,595 | ||||||
| Assets held in rabbi trust | 10,365 | 9,553 | ||||||
| Deferred tax assets, net | 35,933 | 41,321 | ||||||
| Goodwill and other intangible assets, net | 53,525 | 55,696 | ||||||
| Advances and loans, net | 181,944 | 169,955 | ||||||
| Other assets, non-current | 18,092 | 15,859 | ||||||
| Total assets | $ | 883,513 | $ | 1,003,708 | ||||
| Liabilities and stockholders’ equity | ||||||||
| Current liabilities: | ||||||||
| Accounts payable and accrued expenses | $ | 11,893 | $ | 11,450 | ||||
| Deferred compensation and commissions | 43,351 | 75,321 | ||||||
| Operating lease liabilities | 17,838 | 16,984 | ||||||
| Accrued bonuses and other employee related expenses | 11,088 | 38,327 | ||||||
| Other liabilities, current | 4,899 | 9,933 | ||||||
| Total current liabilities | 89,069 | 152,015 | ||||||
| Deferred compensation and commissions | 41,299 | 64,461 | ||||||
| Operating lease liabilities | 78,707 | 65,109 | ||||||
| Other liabilities, non-current | 10,519 | 8,614 | ||||||
| Total liabilities | 219,594 | 290,199 | ||||||
| Commitments and contingencies | — | — | ||||||
| Stockholders’ equity: | ||||||||
| Preferred stock, $0.0001 par value: | ||||||||
| Authorized shares – 25,000,000; issued and outstanding shares – none at June 30, 2022 and December 31, 2022, respectively | — | — | ||||||
| Common stock, $0.0001 par value: | ||||||||
| Authorized shares – 150,000,000; issued and outstanding shares – 38,460,595 and 39,255,838 at June 30, 2022 and December 31, 2022, respectively | 4 | 4 | ||||||
| Additional paid-in capital | 140,142 | 131,541 | ||||||
| Retained earnings | 526,373 | 585,581 | ||||||
| Accumulated other comprehensive loss | (2,600 | ) | (3,617 | ) | ||||
| Total stockholders’ equity | 663,919 | 713,509 | ||||||
| Total liabilities and stockholders’ equity | $ | 883,513 | $ | 1,003,708 | ||||
MARCUS & MILLICHAP, INC.
OTHER INFORMATION
(Unaudited)
Adjusted EBITDA Reconciliation
Adjusted EBITDA, which the Company defines as net (loss) income before (i) interest income and other, including net realized gains (losses) on marketable debt securities, available-for-sale and cash, cash equivalents, and restricted cash, (ii) interest expense, (iii) provision (benefit) for income taxes, (iv) depreciation and amortization, and (v) stock-based compensation. The Company uses Adjusted EBITDA in its business operations to evaluate the performance of its business, develop budgets and measure its performance against those budgets, among other things. The Company also believes that analysts and investors use Adjusted EBITDA as a supplemental measure to evaluate its overall operating performance. However, Adjusted EBITDA has material limitations as a supplemental metric and should not be considered in isolation or as a substitute for analysis of the Company’s results as reported under U.S. generally accepted accounting principles (“U.S. GAAP”). The Company finds Adjusted EBITDA to be a useful management metric to assist in evaluating performance, because Adjusted EBITDA eliminates items related to capital structure, taxes and non-cash items. Considering the foregoing limitations, the Company does not rely solely on Adjusted EBITDA as a performance measure and also considers its U.S. GAAP results. Adjusted EBITDA is not a measurement of the Company’s financial performance under U.S. GAAP and should not be considered as an alternative to net income, operating income or any other measures calculated in accordance with U.S. GAAP. Because Adjusted EBITDA is not calculated in the same manner by all companies, it may not be comparable to other similarly titled measures used by other companies.
A reconciliation of the most directly comparable U.S. GAAP financial measure, net income, to Adjusted EBITDA is as follows (in thousands):
| Three Months Ended June 30, |
Six Months Ended June 30, |
||||||||||||||||
| 2023 | 2022 | 2023 | 2022 | ||||||||||||||
| Net (loss) income | $ | (8,729 | ) | $ | 42,168 | $ | (14,562 | ) | $ | 74,951 | |||||||
| Adjustments: | |||||||||||||||||
| Interest income and other (1) | (4,090 | ) | (979 | ) | (8,480 | ) | (1,594 | ) | |||||||||
| Interest expense | 216 | 158 | 431 | 318 | |||||||||||||
| Provision (benefit) for income taxes | 2,728 | 13,955 | (2,905 | ) | 25,712 | ||||||||||||
| Depreciation and amortization | 3,468 | 3,332 | 6,675 | 7,243 | |||||||||||||
| Stock-based compensation | 5,351 | 4,275 | 10,362 | 8,131 | |||||||||||||
| Adjusted EBITDA | $ | (1,056 | ) | $ | 62,909 | $ | (8,479 | ) | $ | 114,761 | |||||||
| (1) | Other includes net realized gains (losses) on marketable debt securities available-for-sale. | ||||||||||||||||
Glossary of Terms
- Private Client Market segment: transactions with values from $1 million to up to but less than $10 million
- Middle Market segment: transactions with values from $10 million to up to but less than $20 million
- Larger Transaction Market segment: transactions with values of $20 million and above
- Acquisitions: acquisition of businesses accounted for as a business combination in accordance with generally accepted accounting standards
Certain Adjusted Metrics
Real Estate Brokerage
During the six months ended June 30, 2023, we closed a portfolio of large transactions in our real estate brokerage business in excess of $300 million. Following are actual and as adjusted metrics excluding those transactions:
| Three Months Ended June 30, 2023 |
Six Months Ended June 30, 2023 |
|||||||||||
| (actual) | (as adjusted) | (actual) | (as adjusted) | |||||||||
| Total Sales Volume Decrease | (62.0 | )% | (60.1 | )% | (60.4 | )% | (57.5 | )% | ||||
| Average Commission Rate Increase | 3.9 | % | — | % | 8.7 | % | 3.3 | % | ||||
| Average Transaction Size Decrease | (28.3 | )% | (24.7 | )% | (29.3 | )% | (24.3 | )% | ||||
MHProNews note: the parent firm for our publication holds no position in this or other stocks in manufactured housing. Also, the report that follows are per MMI, and may or may not represent the views of MHProNews, which will analyze some of the information they provided in Part III, further below.
Part II – MMI’s 1st Half of 2023 Manufactured Home Communities Report

Manufactured Home Costs on the Rise;
Policymakers Aim to Reduce Affordability Challenges
Home sale prices impacted by supply chain issues. A broad-based housing shortage has caused rising home costs, including for manufactured homes. Supply chain complications during the pandemic directly affected the number of manufactured homes that could be built and shipped, resulting in a backlog of deliveries. Last year noted the highest number of shipments since 2006, exhibiting the property type’s growing popularity, a contributing factor to manufactured home costs rising faster than the cost of a single-family home. Between 2019 and 2022, the median sale price of a single-family home rose from $279,900 to $385,200, nearly a 40 percent increase. Meanwhile, the average sale price of a manufactured home rose from $81,700 to approximately $128,300 in the same period, a 57 percent uptick.
Low vacancy places pressure on rents. Manufactured housing lot development has not kept pace with consumer demand. Local zoning restrictions and a general preference for other land uses often create barriers to the development of new manufactured home communities, making development a lengthy process. While the White House’s Housing Supply Action Plan released in 2022 includes provisions to incentivize relaxed zoning laws, community space will likely remain limited in the near-term. Entering 2023, the national manufactured housing vacancy rate was just 3.3 percent. Supply pressure has translated to higher monthly lot rents across the country. Increasing lot rents are also due, in some instances, to landowners making site and amenity improvements, appealing to a wider tenant base and growing the existing community.
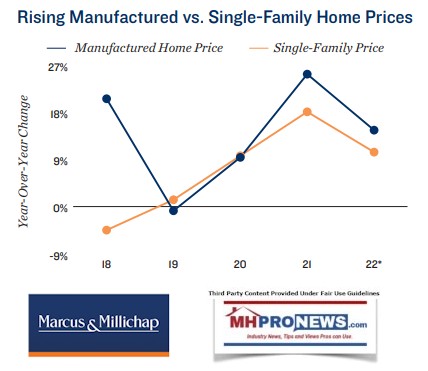
Manufactured homes offer a lower-cost homeownership option. Monthly payments for a manufactured home are below those of a single-family home. The monthly cost of a manufactured home is comprised of a lot rent and the repayment of the loan taken out to purchase the manufactured home. Despite the rising sale price of manufactured homes, their monthly cost is more than $1,000 lower than the average mortgage on a median-priced single-family home. Reforms designed to improve manufactured home loan accessibility will also reduce financing costs long-term and highlight the lower sale price of a manufactured home compared to a single-family home.
Freddie Mac scheduled to assess manufactured home financing. For years, a barrier to manufactured homeownership has been securing financing to purchase a manufactured home. Manufactured homes located on land not owned by the homeowner require a chattel — or personal property — loan used for movable property. While these loans are smaller than a single-family mortgage, higher interest rates and shorter terms contribute to the overall cost. The White House announced in its Housing Supply Action Plan last year that Freddie Mac would complete a feasibility assessment on these loans. In January 2023, Freddie Mac released an action plan for assessing personal property loan requirements for manufactured homes, with the purpose of developing a framework to support loan purchases. The feasibility assessment will take place in 2023, and if FHFA approval is secured, Freddie Mac will purchase 1,500 to 2,500 loans in 2024 to obtain data that will inform future decisions related to a conventional product for long-term use.

| Vacancy |
Macroeconomic headwinds and rising housing costs contribute to declining vacancy. The cost of purchasing a single-family home has risen by nearly 40 percent since 2019. Similarly, the average effective apartment rent per month has increased by around 30 percent. While the price of a manufactured home has also risen during this time, diminishing single- and multifamily affordability has aided vacancy in these communities. Additionally, areas of high net in-migration noted the lowest vacancy rates at the end of 2022. Southern regions saw a vacancy rate 10 basis points below the national average, but high-housing-cost Pacific markets maintained the lowest national vacancy rate at just over 1.0 percent.

Highlights
- Outside of the West, the Southeast maintained the lowest subregion vacancy rate in 2022 as the region noted population growth. Here, vacancy decreased year-over-year in almost every market with more than 8,000 units of inventory. West Palm Beach noted the lowest regional availability rate at 1.8 percent as the metro had one of the top-10 highest mean effective apartment rents going into 2023.
- Texas markets logged the lowest vacancy rates in the Gulf Coast. Houston and Austin both recognized nationally high levels of net in-migration and recorded surging housing costs. Manufactured housing has become an increasingly appealing option for residents in large metros looking to cut costs.
- The eastern region has the smallest total inventory, aiding vacancy here. Baltimore — a market with just under 10,000 units — has the lowest availability in the Northeast at 1.0 percent.
Rent [i.e.: site fees or ‘lot rent.’]
Demand, paired with site renovations, shift rents upward. Availability has become more limited in existing manufactured home communities, placing upward pressure on asking rents. This pressure has been particularly acute in areas of high in-migration and with rising barriers to homeownership. New consumer interest in manufactured homes has also necessitated renovations to many amenities in existing communities. Landowner repairs have improved the quality of housing lots available for rent and contributed to rising monthly costs. In 2022, the national average lot rent reached over $640 per month.

Highlights
- California metros drive higher costs in the West. Orange County had the highest statewide average lot rent in 2022, which rose roughly 16 percent above the 2019 mean. However, this appreciation is significantly below the area’s mean effective apartment rent growth of 27 percent, or mean mortgage payment surge of 86 percent.
- In contrast, the Midwest region continues to offer the most affordable rates in the country, at an average rent below $500 per month. The misalignment of supply and demand is not as prevalent here as in higher-cost housing regions.
- The Eastern region offers an average rent of approximately $519 per month. Meanwhile, the Northeast continues to be the most affordable subregion here, with a mean rent of $513 per month.
Sales [of Land Lease Manufactured Home Communities (MHCs)]
Pockets of buyer competition elevate the average entry cost. A challenging borrowing environment began to slow deal flow at the end of last year. The cumulative impact of interest rate hikes will likely extend financing complications through the first half of 2023. Transactions that did take place, however, assisted in elevating the average price per unit, and the mean cap rate maintained a year-over-year trend of compressing. Cap rates in the mid-6 to high-7 percent range, however, will continue to draw yield-focused investors. The Southeast subregion had the highest number of trades, and investor interest in the area is likely driven by high in-migration facilitating low vacancy and consistent rent growth.

Highlights
- The average price per unit rose the fastest in the South. From 2019 to 2022, the metric increased by nearly 50 percent in the region. This growth was largely driven by the rising price point found in the Gulf Coast in areas with elevating housing costs.
- California and Florida noted the highest volume of transactions during 2022 as investors targeted tight housing markets in the Pacific and ongoing net in-migration to the Southeast. Colder markets saw less activity, but Wisconsin was the most targeted among the Midwest states.
- In the East, North Carolina noted the greatest number of trades. More risk-tolerant investors seeking higher first-year returns may target properties in the Northeast with higher cap rates and a lower.
| Age-Restricted Communities |
Markets popular among retirees may see rising demand as inflation impacts savings. Age-restricted communities account for approximately one-third of total manufactured housing [i.e.: land lease community] inventory in the U.S. The East and Midwest have limited stock reserved solely for the age 55-plus cohort, but over half of the space in the South is age-restricted. Warmer markets in more tax-friendly states have become increasingly popular for retirees, and manufactured housing offers an affordable opportunity to downsize living spaces. The affordability of housing is a growing concern for older individuals, as inflation cuts into retirement savings, further underlying the cost-appeal of manufactured housing for this demographic.

Highlights
- The Pacific Coast had the lowest vacancy rate of any subregion at the end of 2022. This area has the second-highest national inventory for age-restricted communities. This segment typically has a lower average lot rent than non-age-restricted housing, with the mean rent in 2022 landing below $940 per month.
- At the end of the year, Phoenix had the second-greatest volume of age-restricted manufactured housing stock. This coincided with the metro’s local population seeing the most significant year-over-year absolute change in the age 55-plus cohort.
- The East noted the most affordable average rent in this segment last year. This region was closely followed by the Midwest. Both of these areas have limited stock specific to age-restricted communities.

Metro Performance
| Metro | 2022
Vacancy |
Y-O-Y
Basis Point Change |
2022
Average Rent |
Y-O-Y
Change |
| Oakland | 0.4% | 0 | $914 | -1.7% |
| Baltimore | 1.0% | -20 | $771 | 3.8% |
| Sacramento | 1.6% | 10 | $797 | 7.8% |
| Houston | 1.8% | -50 | $517 | 11.9% |
| Fort Lauderdale | 2.1% | -10 | $809 | 3.9% |
| Riverside-San Bernardino | 3.2% | -20 | $804 | 7.1% |
| Austin | 3.4% | 10 | $662 | 5.8% |
| Minneapolis/St. Paul | 3.5% | -20 | $523 | 7.6% |
| Daytona Beach | 3.7% | -20 | $650 | 9.2% |
| Fort Meyers | 3.7% | 0 | $758 | 3.3% |
| Philadelphia | 4.2% | 0 | $581 | 3.9% |
| Chicago | 4.3% | 10 | $742 | 5.4% |
| Tucson | 6.4% | -80 | $482 | 5.5% |
| Cleveland | 7.8% | 80 | $455 | 9.1% |
| St. Louis | 9.1% | 140 | $413 | 5.9% |
| Detroit | 9.8% | -210 | $533 | 6.2% |
| Atlanta | 10.0% | -140 | $576 | 9.3% |
| Sussex | 10.2% | 90 | $650 | 5.0% |
| Las Vegas | 10.3% | -70 | $671 | 5.2% |
| Indianapolis | 12.3% | -260 | $397 | -2.5% |
Per MMI disclaimers:
The information contained in this report was obtained from sources deemed to be reliable. Every effort was made to obtain accurate and complete information; however, no representation, warranty or guarantee, express or implied may be made as to the accuracy or reliability of the information contained herein. This is not intended to be a forecast of future events and this is not a guaranty regarding a future event. This is not intended to provide specific investment advice and should not be considered as investment advice.
Sources: Marcus & Millichap Research Services; Bureau of Labor Statistics; Datacomp-JLT; CoStar Group, Inc.; Institute for Building Technology and Safety; Manufactured Housing Institute; U.S. Census Bureau; White House
Manufactured Housing Communities
Michael Glass Senior
Vice President, Director
Tel: (216) 264-2000 | michael.glass@marcusmillichap.com
Prepared and Edited by
Jessica Henn Research Associate | Research Services
For information on national manufactured housing communities trends, contact:
John Chang Senior Vice President, National Director |
Research & Advisory Services
Tel: (602) 707-9700 | john.chang@marcusmillichap.com
Part III – Additional Information with More MHProNews Analysis and Commentary
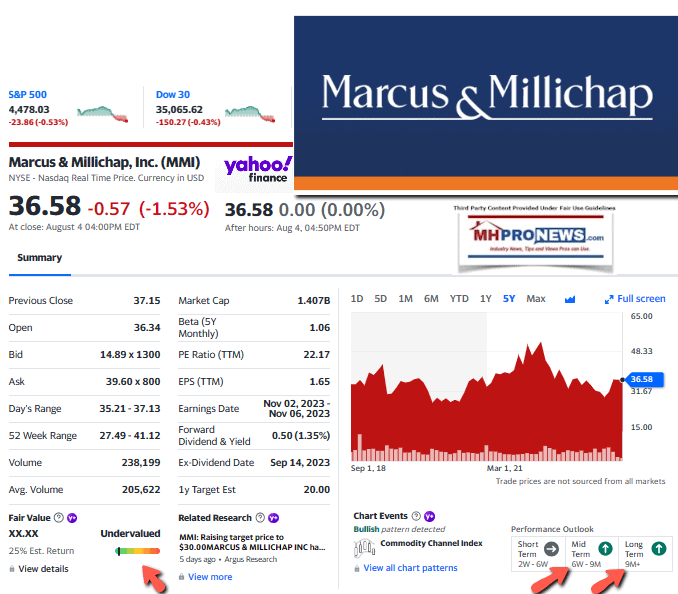
“We are seeing record amounts of capital on the sidelines as evidenced by multiple offers in transactions that are priced appropriately for today’s market.” So said MMI Hessam Nadji president and CEO in the prepared remarks provided in Part I above. For a variety of reasons, numbers of investors have apparent confidence in Nadji and his colleagues, if the snapshot from Yahoo Finance provide below is duly considered. While some of Nadji’s remarks are debatable (e.g.: “We are encouraged by progress on bringing down inflation…”) it is certainly a common view that: “…the Fed’s tightening cycle [i.e.: raising interest rates] nearing its end, which should lead to gradual improvements in market conditions. ”
Notice: the graphic below can be expanded to a larger size.
Within the commercial real estate sphere, manufactured housing has been enjoying a relative bounce. The performance of firms such as Equity LifeStyle Properties (ELS) and Sun Communities in the last decade-plus are part of the reason for that view.
That said, it was Sun Communities (SUI) CEO Gary Shiffman who asserted that there is “no national repository” for information on manufactured home communities (MHC). Shiffman also has spoken about the “scarcity” of manufactured home communities (see below). Additionally, ELS has pointed to some of those factors too. When MMI, or anyone else, cites MHI as a source, they ought to be treated with the “separate the wheat from the chaff” principle routinely applied here to most every person or source. More specifically, the evidence suggests that MHI has arguably had several demonstrable factual errors, beyond reported problems with their purported advocacy of the industry. The second linked item below is but one example of an apparent multi-billion-dollar error peddled by MHI for some years which they recently quietly, and perhaps still errantly, ‘fixed.’
That lack of reliable and agenda-free information arguably makes reports like the one by publicly traded MMI relevant. While the put a price of $500 on this research item, they provide it free to those who sign up for it on their website. Presumably, this is one method of creating a database of possible investors, clients, and others that they can tap into for MMI marketing.
The MMI report leans in part not only on MHI, but also on Datacomp and CoStar. Each of them arguably have their own periodic woes, as is illustrated in the reports that follow.
Those interested in the most accurate possible snapshot of what is occurring in the manufactured home community sector are well advised to carefully gather the information asserted by various publicly traded firms, who routinely happen to be MHI members. The remarks by those firms ought to be carefully compared to those made by MHI on the similar topics. Then, other third-party research should be considered from sources such as the Lincoln Institute of Land Policy. When those sources are compared, the remarks above by MHProNews come into focus. A patchwork of accurate and inaccurate information and claims emerges.

“While the White House’s Housing Supply Action Plan released in 2022 includes provisions to incentivize relaxed zoning laws, community space will likely remain limited in the near-term.” That could be attributed to a ‘politically correct’ expression of reality, or perhaps to something else. What is demonstrable is that HUD’s own researchers said on 9.7.2021 that political leaders among both major parties have been talking about the impact of zoning and regulatory barriers for decades and the problems remain much the same. Details on that are found linked below.

Despite all of the hype about how many times manufactured housing was mentioned in the Biden White House housing action plan the stark reality is that manufactured housing sales – and thus, production – went into a sharp decline in the aftermath of the Biden housing plan. Facts are what they are. The most recent facts on manufactured housing production and shipments are found below.
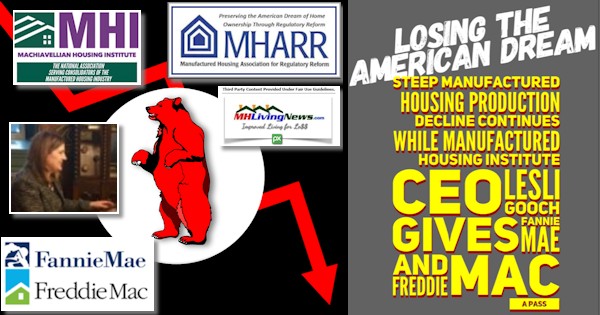
This remark from the above is technically true: “Last year noted the highest number of shipments since 2006,” but following that comma, it inaccurately stated that: “exhibiting the property type’s growing popularity…” Again, the report above makes it clear that manufactured housing is in a sharp decline. During some of the same months that manufactured housing has declined, far more costly conventional housing has risen.
What are the causes of this fact and evidence supported disconnect between HUD Code manufactured housing’s slide and while conventional housing has been rebounding from a rising interest-rate driven slump? MMI correctly observers that part of the issue is zoning and development hurdles.
“Manufactured housing lot development has not kept pace with consumer demand. Local zoning restrictions and a general preference for other land uses often create barriers to the development of new manufactured home communities, making development a lengthy process.” So said MMI’s research for 1H 2023, ironically in the same paragraph that they mentioned the Biden housing plan. Once more for clarity and emphasis, this is a telling example of why separating the proverbial wheat from the chaff must be applied. Not many in media are willing to devote the time and effort, and fewer still have the expertise in manufactured housing found here. Not bragging, but merely stating the realities acknowledged by numbers of industry professionals over the years. That said, attorney Andrew Justus, policy analyst at the Niskanen Housing Center, said that two factors are particularly important in understanding why manufactured housing is not operating as it might. Zoning and financing.

There is a broad consensus around those remarks, although the Manufactured Housing Association for Regulatory Reform (MHARR) has added that the threat of the Department of Energy (DOE) energy regulation standards pending for HUD Code manufactured homes has added yet another hurdle to the regulatory challenge mix. MHARR has pointed out that MHI’s documented and problematic role in that process has essentially brought the industry to this point in time.
Interestingly, Cavco Industries President and CEO William “Bill” Boor has confirmed several of MHARR’s concerns, though they are expressed differently. With respect to the energy standards, Boor said to Congress on behalf of MHI: “If finalized as proposed, these standards would significantly threaten the affordability of new manufactured homes – our nation’s most affordable homeownership option – by imposing costs on homeowners that far exceed any reasonable value placed upon the hoped-for energy savings. Stated otherwise, low-income consumers will be forced bear the cost of an overzealous and ill-informed approach to ESG at the expense of the American dream of homeownership, but also, perhaps counterintuitively, at the expense of helping households move into what for most would be newer and more energy-efficient housing than they have now.”
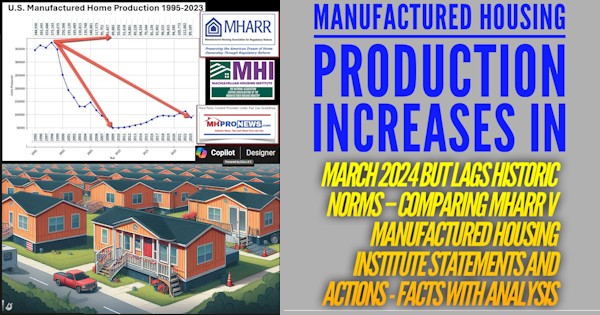
Considering that the lower income consumers that Boor referenced are the core market for manufactured housing buyers, per MHI’s own data claims, this is a grave threat indeed for an industry that has already seen shipments in the first half of 2023 cut back to levels last seen circa 2016 and 2007. If the downward trend continues, how low can manufactured housing production and shipment go in 2023?
Notice: the graphic below can be expanded to a larger size.

Thus, with respect to energy regulations, MHARR has urged that MHI not forsake the apparent advantage that the DOE energy suit gave them.
But other points that Boor raised to Congress also bear mention.

Note that Boor stressed FHA Title I, which indeed does need ‘reform’ because MHI asserts that no loans have been made under the Title I loan program last year. In years gone by, FHA Title I “home only” “personal property” or chattel lending used to provide financing support for thousands of manufactured home buyers. But why didn’t Boor mention the Duty to Serve (DTS) program at that point in his presentation to Congress? Why didn’t Boor ask Congress to issue a letter to the FHFA director Sandra Thompson for now, and an investigation later, on why some 13 years after HERA 2008 made DTS a “mandate” has yet to be put into effect? He asked Congress to support “the preservation, expansion and development of manufactured home communities.” But not DTS on the single family manufactured homes that make up much of the resident-base for those land-lease communities?
To better understand that DTS issue, see the stunning remarks by Gooch, per a document obtained from MHI by MHProNews.
Then look at the reports linked below.
To segue back to MMI’s report, those details shed new light on the dynamics which perhaps for industry politics reasons MMI didn’t mention in their 1H 2023 report, cited above.
The $640 Billion Dollar Question?
Those who watch reruns of old shows, or who have enough gray (covered or not) on their head may recall the CBS broadcast of the $64,000 Question that aired from 1955 to 1958. Because of inflation, that remark morphed into the $64 million (and then billion, etc.) question. Boor led Cavco recently produced research statements for investors that asserted that more affordable housing near the areas they are needed could provide a $2 trillion-dollar annual boost to the U.S. economy. To grasp the details behind that claim better, see the report with analysis linked below. How much of that might flow into aspects of the economy that could benefit manufactured housing? Could it be as much as $640 billion? We may never know, because MHI and its leaders keep dangling carrots without providing the apparently common sense follow through. See the various linked reports for more on that concern. When Boor and company say what’s possible, and then fail to use the legal and lobbying tool properly to ‘make the possible reality’ that is an epic material dereliction of duty, is it not?

What almost no one peering into the manufactured home community sector seems to mention is the obvious analogy with apartments. If apartment construction were to essentially stop in the U.S., what would happen to the rental rates at existing apartments? For a time, rents at apartments would rise more sharply, due to the law of supply and demand. Is it any surprise that when bidding wars have occurred for some MHC properties, combined with a lack of new construction that MMI, MHI and others have acknowledged, that rents are rising more sharply in land-lease communities? At what point will the competing pressures between residents with incomes that are marginal, the need to service debt that supported purchases by consolidators, higher interest rates, and almost no new development of land lease communities reach a tipping point? There are already calls for national rent control in the manufactured home community sector. Right or wrong, won’t those calls for national rent control only increase as the pressures outlined herein grow?

In fairness, the proverbial jury could arguably still be out on MMI and their report. Perhaps more important will be their next report and/or what their follow ups will be in the wake of this analysis. If MMI is to properly serve their prospects, shareholders, and stakeholders of various kinds is perhaps not easy in the current political climate. But that being so, aren’t they duty bound to press the issues as best they can for the sake of all those groups and others too?
Yet Another Looming Cautionary Flag Issue?
The lack of development of manufactured home communities is a genuine issue. Quoting MMI above: “Entering 2023, the national manufactured housing [land lease community] vacancy rate was just 3.3 percent.” If vacancies are truly at some 3.3 percent nationally, and if there are some 4.3 million land-lease sites in the U.S., as is commonly asserted by MHI and others, that should be a multiple alarm bell for the industry. Why? Because per Google’s calculator, 4.3 million times 3.3 percent = 141,900. If MHI is correct in saying in 2022 that 51 percent of production went that year into land-lease communities, in about 2 to 3 years, those land-lease community vacancies could be filled. While some of those sites are owned by property owners that may not have the capital to invest to fill those sites in the manner that consolidators of manufactured housing communities do because of their access to more capital, that could mean that there is less than 2 to 3 years before a lack of developed sites becomes a choke point for producers.
his writer for MHProNews raised that concern in 2017 with several MHI leaders at a meeting. Shortly afterwards, MHProNews‘ parent company was told in an unsigned letter without a person’s name attached to it that our membership was terminated because they had no membership category for news. Pardon me? It took them over 6 years of membership to figure that excuse out? Why weren’t others who claim to produce “news” for the industry similarly ejected? The thinly veiled excuse was doubtlessly because we asked questions and expressed editorial views that supposedly caused MHI to put up signs at their events like the one shown.

The industry has hit several choke points. They were utterly predictable. Indeed, MHARR and MHProNews/MHLivingNews have been predicting the looming barriers for years.
In fairness, MHI has also claimed that they wanted to get more lending, or to see the zoning barriers removed. Boor said the following to Congress last month.
“The manufactured housing industry is at a critical crossroads due to regulatory barriers and market forces. Cumulative shipments from January 1 through April 30, 2023, decreased by 30 percent compared to the same time period of 2022. April 2023 shipments were down 34 percent compared to April 2022 shipments.”
Boor also said:
“Across the country, there are countless state and local zoning, planning, and development restrictions that either severely limit or outright prohibit the placement of a manufactured home.” That being so, why didn’t MHI join hands with MHARR in 2019 (or before) when MHARR offered to litigate the “enhanced preemption” issue that Boor himself asserted to Congress needed to be enforced?

MHProNews provided MHI with several opportunities to get involved in specific zoning issues. Each time, MHI declined, often even declined to respond.
Bryan Manufactured Homes Ban Passed, But Petition Count, Other Legal Moves May Stop Texas City
A pro-MHI MHEC member mocked the efforts of an independent retailer for even bothering to try to stop the ban above. Which begged the question: why wouldn’t a state association and/or MHI join that independent’s efforts, and offer legal support as well? The hypocrisy is startling. An argument can be made that the only reason that the hypocrisy has lasted as long as it has because MHI claims to be doing something, meaning, they are paltering and posturing. Here is how MHARR’s Danny Ghorbani put it.
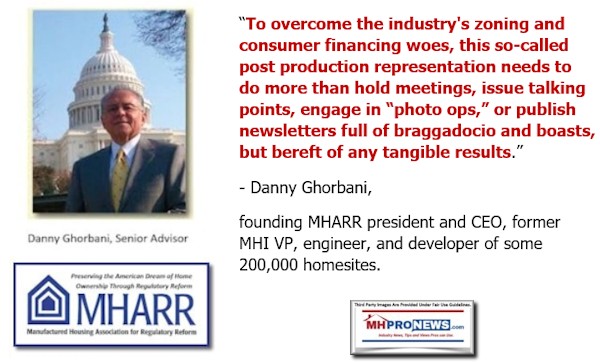

Note that Ghorbani is credited with having supported the development of some 200,000 home sites during his time at MHI. Who has done that since his time?
On financing, on zoning/placement, and on the DOE energy rule – among other issues – MHI has talked an interesting talk. On the surface, it looks similar to MHARR’s. But there are obvious distinctions. MHI gets dues money from the post-production sector. What are they doing to earn those dues? If MHI is in fact working for consolidators, then their dues paid by others who want to see industry growth – not production stagnation or reduction – are being taken under false pretenses.
Given that MHI’s CEO Gooch, in a document obtained by MHProNews from the association she ‘leads’ as CEO, handed Fannie Mae and Freddie Mac a ready made excuse NOT to provide more lending. It is a shocking development that ought to be front page headlines for every trade publisher or blogger in MHVille. So why isn’t it?
There has been a call for some years for MHI to deploy their legal resources in an earnest effort to get existing federal laws enforced. MHI has ignored those calls, just as they did the calls for a legal response to the DOE energy rule issue. But after months of pressure by MHARR and MHProNews, MHI finally relented on the DOE Energy Rule front. Will MHI do so on the other issues? Or will they wait until the crisis is even worse?
At the current vacancy rate, and absent either a serious drop in production/infills into manufactured home communities, the industry is bound to hit a wall. That wall may be harder than it currently is. Who say? By implication, statements, and action, MHI member Legacy Housing.
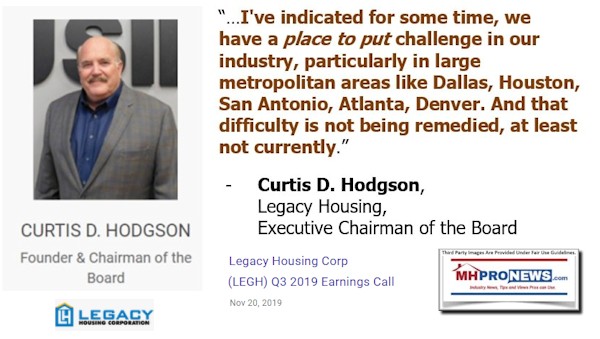
Legacy acquired property specifically to develop homesites for new manufactured homes. How that moves forward, Legacy has said, is an open question. They are exploring options, per the remarks like those in the report linked above. But not many in the industry have that same luxury. Thus, the reason that trade groups are supposed to exist. To deal with issues collectively that are not as easy for smaller firms to deal with individually.
But so long as MHI postures and palters instead of acts and performs, the stunning-to-some reversal in 2023 vs. 2022 or 2021 will continue. This is why researchers cited in the report linked below have said that MHI and several of their leading brands appear to be colluding to keep the industry underperforming while they consolidate the industry.

No matter how much some caterwaul about our reports, analysis and commentary, they are not only documented to be the most read, such reports and analysis logically also make the most sense. Our editorial goal is to support a robust industry growth. That apparently will not happen unless the status quo is dramatically changed. To change the status quo, the powers that be behind MHI have to be pushed into acting in the interests of all, not the interests of consolidation-minded thinking.
The irony is that there is that there is arguably far more money to be made by growing the business than by choking off business so that only a few survive. The evidence for that was provided by Cavco and others. Whatever happens next, count on MHProNews to provide you and others with the factual, evidence-based reports and commentaries that you will find nowhere else in manufactured housing. ###


Again, our thanks to free email subscribers and all readers like you, as well as our tipsters/sources, sponsors and God for making and keeping us the runaway number one source for authentic “News through the lens of manufactured homes and factory-built housing” © where “We Provide, You Decide.” © ## (Affordable housing, manufactured homes, reports, fact-checks, analysis, and commentary. Third-party images or content are provided under fair use guidelines for media.) See Related Reports, further below. Text/image boxes often are hot-linked to other reports that can be access by clicking on them.)

By L.A. “Tony” Kovach – for MHProNews.com.
Tony earned a journalism scholarship and earned numerous awards in history and in manufactured housing.
For example, he earned the prestigious Lottinville Award in history from the University of Oklahoma, where he studied history and business management. He’s a managing member and co-founder of LifeStyle Factory Homes, LLC, the parent company to MHProNews, and MHLivingNews.com.
This article reflects the LLC’s and/or the writer’s position and may or may not reflect the views of sponsors or supporters.
Connect on LinkedIn: http://www.linkedin.com/in/latonykovach
Related References:
The text/image boxes below are linked to other reports, which can be accessed by clicking on them.’


