

“Knowledge is potential power” is the English translation for the Latin aphorism, “Scientia potentia est.” In an email from the Capital Research Center (CRC), Tom Woods and Michael Malice have been credited with charging that rather than speaking truth to power, journalists today often serve as the lapdogs for the powerful. CRC added that “Journalists don’t just report the news, they create it. Journalists have double standards for those who support vs. those who oppose the narrative journalists are pushing.” The Media Research Center (MRC), Glenn Greenwald and others from within and across the left-right media divide have at various times made similar assertions. If the survey claims linked here – with a manufactured housing connection – is an indicator, the fact that 73 percent of Americans are “dissatisfied” with major corporations, the so-called great awakening may be approaching. This report will feature what may initially seem to be several disconnected elements that will include the bulk of the press release from publicly traded Sun Communities (SUI). Sun is one of several public firms that are members of the Manufactured Housing Institute (MHI). A letter addressed from an attorney acting on behalf of MHI is addressed to what was at that time a MHI/National Communities Council (NCC) member. Right or wrong, Spencer Roane with Pentagon Properties dared question MHI’s leadership and pushed back in public against what he expressed that was slander aimed at him. The context of that MHI attorney’s letter could be described as their reaction to their being publicly questioned, and in some sense, threatened. The MHI response could fairly be described in part as threatening Roane back. This report, analysis, and commentary will bring together several seemingly disjointed threads to reveal the context – and risk potential – for those rosy numbers being reported by MHI member Sun (SUI).
In no particular order of importance, against that backdrop, MHProNews will first look back in time at a letter from the law firm of “Webster, Chamberlain & Bean, LLP,” based in Washington, D.C. to Spencer Roane. When the Sun Communities press release is presented later below, it should not be construed as an endorsement of the firm or its stock. There will be additional information there too, which will include quotes and previous statements by Sun leadership. But there will also be references to other MHI member brands, numbers of which are part of a larger publicly traded operation.
Part I – Attorney Letter to then MHI Member Spencer Roane
Roane was at that time, as the letter below stated, president of Pentagon Properties. They were a member of MHI’s National Communities Council. The letter in good measure speaks for itself. But following this letter will be additional linked information. A PDF of the attorney’s letter on behalf of MHI is available at this link here, with the text being reproduced below.

November 30, 2012
Mr. Spencer Roane
President
Pentagon Properties, Inc.
P.O. Box 20256
Atlanta, GA 30325
Re: MHI/NCC Matter
Dear Mr. Roane:
My firm represents the Manufactured Housing Institute (hereinafter referred to as “Institute” or “MHI”).
I have been asked to respond to your numerous communications regarding an MHI/ National Communities Council (“NCC”) meeting held on October 8, 2012 (the “Meeting”).
Without addressing each and every allegation and assertion you make individually, the most succinct summation of MHI’s position is as follows.
Based on the facts presented regarding what was stated at the Meeting we have determined that no “slanderous or defamatory” comments were made against you. To be even clearer, MHI’s position, with the Executive Committee of the Board being fully briefed on the matter, is that no laws were broken and no legal cause of action exists on your part against MHI, NCC or the Chairman of the NCC Division as a result of the proceedings at the Meeting; and MHI considers the matter closed.
As you are aware from your years of participation, MHI is the nation’s leading trade organization representing all segments of the factory built housing industry. By virtue of that definition, it is understood MHI represents a broad spectrum on business interests within the industry (e.g., business, size, geography, business models, etc.) and that this diverse membership will often express a wide range of views on issues and Institute activity. MHI, in fact, seeks out all points of view on industry issues anticipating they will contribute to the discussion and ultimately the most favorable, widely supported outcomes. While both democracy and dissension at times can be a strenuous process, every disagreement, differing point of view, or opinion asserted (whether officially on behalf of the organization or in ones own personal capacity) does not warrant legal action, apologies, or the need for point by point rebuttals (the reason why, as stated above, this letter does not attempt to address all of your allegations regarding, for example, that comments were “mean spirited”).
In conclusion, MHI/ NCC will continue to work for the best interest of the industry inviting comments, the occasional contentious debate, pursuing the goal of productive meetings and measurable success.
Notwithstanding the foregoing, however, MHI’s most valuable asset is its name and reputation. Over the years, MHI has diligently worked to serve the industry and establish significant good will within its membership, the industry at-large, as well as with the government and the consumers the membership serves. MHI actively monitors and proactively addresses any attempts by third parties who wrongfully disparage the organization. Therefore, to the extent any third party communicates (orally, in writing, electronically) untrue, false, fabricated deleterious statements regarding MHI, the Institute is firmly committed to pursue every legal remedy available to preserve the reputation it has worked so hard to establish and maintain. This includes statements made from its membership as well.
If you have any questions regarding this foregoing, please feel free to contact me.
Sincerely,
David P. Goch
cc: Richard Jennison, President & CEO, MHI
cc: Don Glisson, Jr., Chairman, MHI
##
Part II. Additional Information, More Commentary and Analysis Regarding MHI,
Attorneys Acting on Behalf of MHI, and Roane
In no particular order of importance, are the following points to be considered.
1) The letter to Roane reflects the point that MHI is obviously willing and able to hirer an outside counsel to engage in legal issues. 2) The letter itself makes various claims that beg examination. For instance. MHI has at various times claimed that it is working for “consensus.” Some voices acting on behalf of MHI interests have gone so far as to assert that there had to be consensus if manufactured housing would achieve its goals with, for example, the U.S. Department of Housing and Urban Development (HUD). That noted, HUD’s official spokesperson denied that such was necessary, expected or even reasonably achievable.
More specifically, HUD’s media relations office told MHProNews that claims by MHI that there had to be consensus “do not comport with HUD policy.” While there are several ways to frame that, one is that MHI has been misrepresenting that claim to their own members – and the industry at large – for years.
Sparks Fly – MHI, HUD Allegations Do “Not Comport with HUD Policy”
3) A few of several pull quotes from Goch’s letter to Roane on behalf of MHI that merit scrutiny are as follows. MHProNews inquired this morning with Goch if he believes that these claims are valid today? That reply from Goch is pending as this report and analysis are being produced.


4) The letter to Roane should also be considered in the light of letters by various attorneys to MHProNews, some noted and linked in the report found here, during and after our membership at MHI. Those attorneys letters either stated and/or by implication indicated they were acting on behalf of the interests of MHI. Additionally, there are numerous quite public examples that MHI and several of their dominating brands ducked public debate. Or where MHI/NCC – and its inside/outside counsels or several of their major brands – ducked input from members or others. Rephrased, Goch was either speaking in demonstrable ignorance of reality or he was spinning and manipulating reality on behalf of MHI, quite to the contrary of numerous examples and well documented history.


5) This fact check should not be construed as a defense of Roane. MHProNews has previously documented problems he and his colleague George F. Allen have been involved in. See the reports linked below to learn more. Rather, spotlighting this letter is demonstrate several key items. One, MHI is willing and able to use attorneys to achieve their desired end, be that goal right or wrong.

George Allen Blasts MHI, NCC Ignoring Own, Spencer Roane, SECO, COBA7, Tom Lackey Controversies
6) Next, MHI has demonstrably NOT employed attorneys to do what Danny Ghorbani said is necessary in the Q&A, report, fact check and analysis linked below.

7) While this troubling landscape involving MHI is painted, the evidence-based question arises. Why would should MHI staff and key board leaders fail to aggressively promote – through legal action, if necessary – the full and proper implementation of good existing laws that were designed by Congress to protect consumers and advance affordable manufactured home ownership? The only logic thesis that has stood the test of time is that an apparently stealthy form of consolidation is sought. MHI and their leaders claim something, but upon examination, it is often arguably proven not to be true. Restated, there is often a need to “invert” – see the headline – a claim by MHI and their dominating brands to see if it stands up to scrutiny. That noted, ironically MHI’s own members have made it plain that they want consolidation. Thus, it is MHI members who are in some ways the strongest evidence that Goch and MHI’s claims of working for all segments of the industry are, to put it politely, hooey. A few examples from MHI members, and linked reports that examine them in more detail, will make the point.


8) Some lies and behaviors are so big and bold that it is hard for normal people to get their minds around the level of audacity needed to make such a claim. Note that Jody Gabel, J.D., has thus far – days later – declined to respond to MHProNews’ inquires. So much for Goch’s claim that MHI – and/or their inside/outside attorneys – want engagement, debate, and input? Isn’t the claim absurd on its face when someone is informed about the issues? Thus, the value of the Latin aphorism, “Scientia potentia est.” Or “Knowledge is potential power.”


9) It is in the light of the above, plus the notion that high profile MHI member Cavco Industries is still under and SEC cloud, that the report that follows about Sun Communities should be examined.
10) Why? Because if the public mood – and manufactured housing independents’ grumblings – shifts enough, there may well be a CAVCO (CVCO) style dust-up ahead for not only Sun, but others who are apparently consolidating under the cover of MHI’s defensive mantle.


With that backdrop, let’s now proceed to Part III, the actual Sun Communities press release. If you are a Sun share holder, consider in the light of the above and what follows when the best time to sell your shares might be. Following that Sun media release will be additional information, and then the balance of our 7.26.2021 market report.
Part III. Sun Communities Press Release. (Notice: publishing this release should not be misunderstood as an endorsement of the stock or operation.)
Sun Communities, Inc. Reports 2021 Second Quarter Results
Sun Communities, Inc.
Mon, July 26, 2021, 4:35 PM
NEWS RELEASE
July 26, 2021
Sun Communities, Inc. Reports 2021 Second Quarter Results
Southfield, MI, July 26, 2021 (GLOBE NEWSWIRE) — Sun Communities, Inc. (NYSE: SUI) (the “Company”), a real estate investment trust (“REIT”) that owns and operates, or has an interest in, manufactured housing (“MH”) communities, recreational vehicle (“RV”) resorts and marinas, (collectively, the “properties”), today reported its second quarter results for 2021.
Financial Results for the Quarter and Six Months Ended June 30, 2021
For the quarter ended June 30, 2021, total revenues increased $300.6 million, or 99.1 percent, to approximately $603.9 million compared to $303.3 million for the same period in 2020. Net income attributable to common stockholders increased $51.9 million or 88.0 percent, to approximately $110.8 million, or $0.98 per diluted common share, compared to net income attributable to common stockholders of $58.9 million, or $0.61 per diluted common share, for the same period in 2020.
For the six months ended June 30, 2021, total revenues increased $432.3 million, or 70.5 percent, to $1.0 billion compared to approximately $613.6 million for the same period in 2020. Net income attributable to common stockholders increased $92.7 million or 216.5 percent, to approximately $135.6 million, or $1.22 per diluted common share, compared to net income attributable to common stockholders of $42.8 million, or $0.45 per diluted common share, for the same period in 2020.
Non-GAAP Financial Measures and Portfolio Performance
- Core Funds from Operations (“Core FFO”)(1) for the quarter ended June 30, 2021, was $1.80 per diluted share and OP unit (“Share”) as compared to $1.12 in the corresponding period in 2020, a 60.7 percent increase.
- Same Community(2) Net Operating Income (“NOI”)(1) increased by 21.6 percent for the quarter ended June 30, 2021, as compared to the corresponding period in 2020.
- Home Sales Volume increased 89.5 percent to 1,158 homes for the quarter ended June 30, 2021, as compared to 611 homes in the same period in 2020.
- Acquisitions totaled $719.4 million during and subsequent to the quarter ended June 30, 2021, including 10 MH communities, two RV resorts and six marinas.
Gary Shiffman, Chief Executive Officer stated, “Sun’s ongoing strong momentum continued through the second quarter, as we saw robust performance across RV, Manufactured Housing and Marinas. Our RV business is demonstrating the growing appeal of an RV vacation for consumers, marinas are in the midst of an active boating season and our results continue to track ahead of our underwriting, and in our manufactured housing business, we are benefiting from sustained demand for affordable housing. Furthermore, our RV forward bookings have continued to accelerate and we are pleased to again increase our guidance for the year.”
Mr. Shiffman continued, “We have remained active in terms of new site deliveries and have more than 9,400 sites available for development, representing an attractive source of growth and value creation over time. We also deployed over $719 million in acquisitions, including six marinas as we begin to realize the meaningful consolidation opportunity we have in the marina industry. To support this ongoing growth, we are pleased to have received investment grade ratings and completed our inaugural unsecured bond issuance as we issued $600 million in senior unsecured notes. This additional financing option provides Sun enhanced financial flexibility to efficiently match fund our investment activities as we continue to realize compelling growth opportunities across all of our businesses.”
OPERATING HIGHLIGHTS
Portfolio Occupancy
Total MH and annual RV occupancy was 97.4 percent at June 30, 2021, compared to 97.3 percent at June 30, 2020, an increase of 10 basis points.
During the quarter ended June 30, 2021, MH and annual RV revenue producing sites increased by 583 sites, as compared to an increase of 851 revenue producing sites during the quarter ended June 30, 2020.
During the six months ended June 30, 2021, MH and annual RV revenue producing sites increased by 1,097 sites, as compared to an increase of 1,151 revenue producing sites during the six months ended June 30, 2020.
Same Community(2) Results
For the 405 MH and RV properties owned and operated by the Company since January 1, 2020, the following table reflects the NOI(1) percentage increases, in total and by segment, for the quarter and six months ended June 30, 2021:
| Quarter Ended June 30, 2021 | ||||||||
| Total Same Community | MH | RV | ||||||
| Revenue | 22.5 | % | 6.9 | % | 64.4 | % | ||
| Expense | 24.7 | % | 11.8 | % | 41.9 | % | ||
| NOI | 21.6 | % | 5.4 | % | 85.1 | % | ||
| Six Months Ended June 30, 2021 | ||||||||
| Total Same Community | MH | RV | ||||||
| Revenue | 12.8 | % | 6.0 | % | 30.2 | % | ||
| Expense | 15.2 | % | 8.7 | % | 24.2 | % | ||
| NOI | 11.8 | % | 5.1 | % | 34.8 | % | ||
Same Community adjusted occupancy(3) increased to 98.8 percent at June 30, 2021 from 97.2 percent at June 30, 2020.
Home Sales
During the quarter ended June 30, 2021, the Company sold 1,158 homes as compared to 611 homes in the same period in 2020, an increase of 89.5 percent. The Company sold 227 and 140 new homes for the quarters ended June 30, 2021 and 2020, respectively, an increase of 62.1 percent. Pre-owned home sales were 931 in the second quarter 2021 as compared to 471 in the same period in 2020, an increase of 97.7 percent.
During the six months ended June 30, 2021, the Company sold 1,993 homes as compared to 1,374 homes in the same period in 2020, an increase of 45.1 percent. The Company sold 376 and 259 new homes for the six months ended June 30, 2021 and 2020, respectively, an increase of 45.2 percent. Pre-owned home sales were 1,617 in the six months ended June 30, 2021 as compared to 1,115 in the same period in 2020, an increase of 45.0 percent.
Marina Results
Marina NOI was $62.8 million and $94.2 million for the quarter and six months ended June 30, 2021, respectively. Refer to page 15 for additional information regarding the marina portfolio operating results.
PORTFOLIO ACTIVITY
Acquisitions and Dispositions
During and subsequent to the quarter ended June 30, 2021, the Company acquired the following communities, resorts and marinas:
| Property Name | Property Type | Sites, Wet Slips and Dry Storage Spaces |
Development Sites | State / Province | Total Purchase Price (in millions) |
Month Acquired | ||||||||||
| ThemeWorld RV Resort | RV | 148 | — | FL | $ | 25.0 | April | |||||||||
| Sylvan Glen Estates(a) | MH | 476 | — | MI | 24.0 | April | ||||||||||
| Shelter Island Boatyard | Marina | 55 | N/A | CA | 10.0 | May | ||||||||||
| Lauderdale Marine Center | Marina | 202 | N/A | FL | 340.2 | May | ||||||||||
| Apponaug Harbor(b) | Marina | 378 | N/A | RI | 6.6 | June | ||||||||||
| Cabrillo Isle(c) | Marina | 483 | N/A | CA | 46.9 | June | ||||||||||
| Marathon Marina | Marina | 147 | N/A | FL | 19.1 | June | ||||||||||
| Subtotal | 1,889 | — | 471.8 | |||||||||||||
| Acquisitions subsequent to quarter end | ||||||||||||||||
| Allen Harbor | Marina | 165 | N/A | RI | 4.0 | July | ||||||||||
| Cisco Grove Campground & RV | RV | 18 | 407 | CA | 6.6 | July | ||||||||||
| Four Leaf Portfolio(d) | MH | 2,714 | 171 | MI / IN | 215.0 | July | ||||||||||
| Harborage Yacht Club | Marina | 300 | N/A | FL | 22.0 | July | ||||||||||
| Subtotal | 3,197 | 578 | 247.6 | |||||||||||||
| Total acquisitions | 5,086 | 578 | $ | 719.4 | ||||||||||||
(a) In conjunction with the acquisition, the Company issued 240,000 Series J preferred OP units.
(b) Combined with an existing adjacent marina.
(c) Acquired in connection with Safe Harbor Marinas acquisition. Transfer of the marinas was contingent on receiving third party consent.
(d) Contains nine MH communities.
During and subsequent to the six months ended June 30, 2021 the Company acquired 28 properties totaling 7,666 sites, wet slips and dry storage spaces, and 578 sites for development for a total purchase price of $853.4 million.
Subsequent to the quarter ended June 30, 2021, the Company sold two MH communities located in Indiana and Missouri for $67.5 million. The assets and liabilities associated with the transaction were classified as held for sale on the Consolidated Balance Sheets as of June 30, 2021.
Construction Activity
During the quarter ended June 30, 2021, the Company completed the construction of over 100 sites in two ground-up developments and over 120 expansion sites in two MH communities and one RV resort.
Year to date June 30, 2021, the Company completed the construction of over 350 sites in three ground-up development and over 230 expansion sites in three MH communities and one RV resort.
BALANCE SHEET, CAPITAL MARKETS ACTIVITY AND OTHER ITEMS
Debt
As of June 30, 2021, the Company had approximately $4.3 billion in debt outstanding. The weighted average interest rate was 3.5 percent and the weighted average maturity was 10.4 years. At June 30, 2021, the Company’s net debt to trailing twelve month Recurring EBITDA(1) ratio was 5.1 times. The Company had $103.5 million of unrestricted cash on hand.
Senior Unsecured Notes
On June 14, 2021, the Company received investment grade ratings of BBB and Baa3 with a stable outlook from S&P Global and Moody’s, respectively.
On June 28, 2021, Sun Communities Operating Limited Partnership (“SCOLP”), the Company’s operating partnership, issued $600.0 million of senior unsecured notes with an interest rate of 2.7 percent and a ten-year term, due 2031. The net proceeds from the offering were $592.4 million, after deducting underwriters’ discount and estimated offering expenses.
Credit Agreement
On June 14, 2021, SCOLP, as borrower, and the Company, as guarantor, entered into a new credit agreement with certain lenders. The new credit agreement combines and replaces SCOLP’s $750.0 million credit facility which was scheduled to mature May 21, 2023, and the $1.8 billion credit facility of the Company’s marina subsidiary, Safe Harbor Marinas, LLC (the “Safe Harbor Facility”) which was scheduled to mature on October 11, 2024. The Safe Harbor Facility was terminated in connection with the execution of the new credit agreement and all amounts due and outstanding were repaid on or prior to the date of the New Credit Agreement. The Company recognized a loss on extinguishment of debt in its Consolidated Statement of Operations related to the termination of these prior credit facilities of $0.2 million and $7.9 million, respectively.
Pursuant to the New Credit Agreement, SCOLP may borrow up to $2.0 billion under a revolving loan (the “New Credit Facility”) to fund the business of SCOLP and all its subsidiaries. The New Credit Facility has a four-year term ending June 14, 2025. Subject to the satisfaction of certain conditions, the term may be extended for two additional six-month periods, and additional borrowings not to exceed $1.0 billion is permitted. However, the maturity date with respect to $500.0 million of available borrowing under the New Credit Facility is October 11, 2024, which may not be extended. The New Credit Facility bears interest at a floating rate based on the Adjusted Eurocurrency Rate or Australian Bank Bill Swap Bid Rate (BBSY), plus a margin which can range from 0.725 percent to 1.400 percent. As of June 30, 2021, the margin based on our credit ratings was 0.850 percent on the New Credit Facility. The Company had $190.3 million of borrowings on the New Credit Facility as of June 30, 2021.
Equity Transactions
Public Equity Offering
In May and June 2021, the Company completed the physical settlement of the remaining 4,050,000 shares offered under the forward sale agreement pursuant to the Company’s March 2021 equity offering of 8,050,000 shares. Net proceeds of $539.7 million after deducting expenses related to the offering, were used to acquire assets and pay down the Safe Harbor Facility.
At the Market Offering Sales Agreements
In June 2021, the Company entered into an At the Market Offering (ATM) Sales Agreement (the “Sales Agreement”) with certain sales agents, forward sellers, pursuant to which the Company may sell, from time to time, up to an aggregate gross sales price of $500.0 million of its common stock. No shares were sold during the quarter ending June 30, 2021 under the ATM program. Upon entering into the Sales Agreement, the Company simultaneously terminated its previous ATM sales agreement entered into in July 2017.
2021 GUIDANCE
The Company is providing revised or initial 2021 guidance for the following metrics:
| Previous Range | Revised Range | ||||||||||
| FY 2021E | FY 2021E | 3Q 2021E | |||||||||
| Basic earnings per share | $1.68 – $1.84 | $2.24 – $2.36 | $0.90 – $0.96 | ||||||||
| Core FFO(1) per fully diluted Share | $5.92 – $6.08 | $6.25 – $6.37 | $2.00 – $2.06 | ||||||||
| 1Q21 | 2Q21 | 3Q21 | 4Q21 | ||||||||
| Seasonality of Core FFO(1) per fully diluted Share | 20.0 | % | 28.5 | % | 32.1 | % | 19.4 | % | |||
Seasonality of Core FFO(1) per fully diluted Share is based off of the midpoint of full year guidance.
| Previous Range | Revised Range | ||||||
| FY 2021E | FY 2021E | 3Q 2021E | |||||
| Same Community NOI(1) growth | 7.5% – 8.5% | 9.9% – 10.7% | 11.2% – 12.0% |
Guidance estimates include acquisitions completed through the date of this release and exclude any prospective acquisitions or capital markets activity.
The estimates and assumptions presented above represent a range of possible outcomes and may differ materially from actual results. The estimates and assumptions are forward looking based on the Company’s current assessment of economic and market conditions, as well as other risks outlined below under the caption “Cautionary Statement Regarding Forward-Looking Statements.”
EARNINGS CONFERENCE CALL
A conference call to discuss second quarter results will be held on Tuesday, July 27, 2021 at 11:00 A.M. (ET). To participate, call toll-free (877) 407-9039. Callers outside the U.S. or Canada can access the call at (201) 689-8470. A replay will be available following the call through August 10, 2021 and can be accessed toll-free by calling (844) 512-2921 or (412) 317-6671. The Conference ID number for the call and the replay is 13720116. The conference call will be available live on Sun Communities’ website located at www.suncommunities.com. The replay will also be available on the website.
Sun Communities, Inc. is a REIT that, as of June 30, 2021, owned, operated, or had an interest in a portfolio of 569 developed MH, RV and marina properties comprising over 153,300 developed sites and nearly 41,300 wet slips and dry storage spaces in 39 states and Ontario, Canada.
For more information about Sun Communities, Inc., please visit www.suncommunities.com.
CAUTIONARY STATEMENT REGARDING FORWARD-LOOKING STATEMENTS
This press release contains various “forward-looking statements” within the meaning of the Securities Act of 1933, as amended, and the Securities Exchange Act of 1934, as amended, and the Company intends that such forward-looking statements will be subject to the safe harbors created thereby. For this purpose, any statements contained in this press release that relate to expectations, beliefs, projections, future plans and strategies, trends or prospective events or developments and similar expressions concerning matters that are not historical facts are deemed to be forward-looking statements. Words such as “forecasts,” “intends,” “intend,” “intended,” “goal,” “estimate,” “estimates,” “expects,” “expect,” “expected,” “project,” “projected,” “projections,” “plans,” “predicts,” “potential,” “seeks,” “anticipates,” “anticipated,” “should,” “could,” “may,” “will,” “designed to,” “foreseeable future,” “believe,” “believes,” “scheduled,” “guidance,” “target” and similar expressions are intended to identify forward-looking statements, although not all forward looking statements contain these words. These forward-looking statements reflect the Company’s current views with respect to future events and financial performance, but involve known and unknown risks, uncertainties and other factors, both general and specific to the matters discussed in or incorporated herein, some of which are beyond the Company’s control. These risks, uncertainties and other factors may cause the Company’s actual results to be materially different from any future results expressed or implied by such forward-looking statements. In addition to the risks disclosed under “Risk Factors” contained in the Company’s Annual Report on Form 10-K for the year ended December 31, 2020 and in the Company’s other filings with the Securities and Exchange Commission from time to time, such risks, uncertainties and other factors include but are not limited to:
- outbreaks of disease, including the COVID-19 pandemic, and related stay-at-home orders, quarantine policies and restrictions on travel, trade and business operations;
- changes in general economic conditions, the real estate industry and the markets in which the Company operates;
- difficulties in the Company’s ability to evaluate, finance, complete and integrate acquisitions, developments and expansions successfully;
- the Company’s liquidity and refinancing demands;
- the Company’s ability to obtain or refinance maturing debt;
- the Company’s ability to maintain compliance with covenants contained in its debt facilities and its senior unsecured notes;
- availability of capital;
- changes in foreign currency exchange rates, including between the U.S. dollar and each of the Canadian and Australian dollars;
- the Company’s ability to maintain rental rates and occupancy levels;
- the Company’s ability to maintain effective internal control over financial reporting and disclosure controls and procedures;
- increases in interest rates and operating costs, including insurance premiums and real property taxes;
- risks related to natural disasters such as hurricanes, earthquakes, floods and wildfires;
- general volatility of the capital markets and the market price of shares of the Company’s capital stock;
- the Company’s ability to maintain its status as a REIT;
- changes in real estate and zoning laws and regulations;
- legislative or regulatory changes, including changes to laws governing the taxation of REITs;
- litigation, judgments or settlements;
- competitive market forces;
- the ability of purchasers of manufactured homes and boats to obtain financing; and
- the level of repossessions by manufactured home lenders.
Readers are cautioned not to place undue reliance on these forward-looking statements, which speak only as of the date the statement was made. The Company undertakes no obligation to publicly update or revise any forward-looking statements included in this press release, whether as a result of new information, future events, changes in its expectations or otherwise, except as required by law.
Although the Company believes that the expectations reflected in the forward-looking statements are reasonable, it cannot guarantee future results, levels of activity, performance or achievements. All written and oral forward-looking statements attributable to the Company or persons acting on its behalf are qualified in their entirety by these cautionary statements.
Investor Information
| RESEARCH COVERAGE | ||||||
| Firm | Analyst | Phone | ||||
| Bank of America Merrill Lynch | Joshua Dennerlein | (646) 855-1681 | joshua.dennerlein@baml.com | |||
| Berenberg Capital Markets | Keegan Carl | (646) 949-9052 | keegan.carl@berenberg-us.com | |||
| BMO Capital Markets | John Kim | (212) 885-4115 | johnp.kim@bmo.com | |||
| Citi Research | Michael Bilerman | (212) 816-1383 | michael.bilerman@citi.com | |||
| Nicholas Joseph | (212) 816-1909 | nicholas.joseph@citi.com | ||||
| Evercore ISI | Steve Sakwa | (212) 446-9462 | steve.sakwa@evercoreisi.com | |||
| Samir Khanal | (212) 888-3796 | samir.khanal@evercoreisi.com | ||||
| Green Street Advisors | John Pawlowski | (949) 640-8780 | jpawlowski@greenstreetadvisors.com | |||
| Robert W. Baird & Co. | Wesley Golladay | (216) 737-7510 | wgolladay@rwbaird.com | |||
| RBC Capital Markets | Brad Heffern | (512) 708-6311 | brad.heffern@rbccm.com | |||
| UBS | Michael Goldsmith | (212) 713-2951 | michael.goldsmith@ubs.com | |||
| Wells Fargo | Todd Stender | (562) 637-1371 | todd.stender@wellsfargo.com | |||
| INQUIRIES | ||||||
| Sun Communities welcomes questions or comments from stockholders, analysts, investment managers, media, or any prospective investor. Please address all inquiries to our Investor Relations department. | ||||||
| At Our Website | www.suncommunities.com | |||||
| By Email | investorrelations@suncommunities.com | |||||
| By Phone | (248) 208-2500 | |||||
Portfolio Overview
(As of June 30, 2021)
Financial and Operating Highlights
(amounts in thousands, except for *)
| Quarter Ended | |||||||||||||||||||
| 6/30/2021 | 3/31/2021 | 12/31/2020 | 9/30/2020 | 6/30/2020 | |||||||||||||||
| Financial Information | |||||||||||||||||||
| Total revenues | $ | 603,863 | $ | 442,015 | $ | 384,265 | $ | 400,514 | $ | 303,266 | |||||||||
| Net income | $ | 120,849 | $ | 27,941 | $ | 9,818 | $ | 89,756 | $ | 63,355 | |||||||||
| Net income attributable to Sun Communities Inc. common stockholders | $ | 110,770 | $ | 24,782 | $ | 7,586 | $ | 81,204 | $ | 58,910 | |||||||||
| Basic earnings per share* | $ | 0.98 | $ | 0.23 | $ | 0.07 | $ | 0.83 | $ | 0.61 | |||||||||
| Diluted earnings per share* | $ | 0.98 | $ | 0.23 | $ | 0.07 | $ | 0.83 | $ | 0.61 | |||||||||
| Cash distributions declared per common share* | $ | 0.83 | $ | 0.83 | $ | 0.79 | $ | 0.79 | $ | 0.79 | |||||||||
| Recurring EBITDA(1) | $ | 268,225 | $ | 190,830 | $ | 168,527 | $ | 199,321 | $ | 148,650 | |||||||||
| FFO attributable to Sun Communities, Inc. common stockholders and dilutive convertible securities(1)(4) | $ | 198,017 | $ | 135,925 | $ | 110,849 | $ | 165,209 | $ | 118,092 | |||||||||
| Core FFO attributable to Sun Communities, Inc. common stockholders and dilutive convertible securities(1)(4) | $ | 209,620 | $ | 141,036 | $ | 124,872 | $ | 162,624 | $ | 110,325 | |||||||||
| FFO attributable to Sun Communities, Inc. common stockholders and dilutive convertible securities(1)(4) per share – fully diluted* | $ | 1.70 | $ | 1.22 | $ | 1.03 | $ | 1.63 | $ | 1.20 | |||||||||
| Core FFO attributable to Sun Communities, Inc. common stockholders and dilutive convertible securities(1)(4) per share – fully diluted* | $ | 1.80 | $ | 1.26 | $ | 1.16 | $ | 1.60 | $ | 1.12 | |||||||||
| Balance Sheet | |||||||||||||||||||
| Total assets | $ | 12,040,990 | $ | 11,454,209 | $ | 11,206,586 | $ | 8,335,717 | $ | 8,348,659 | |||||||||
| Total debt | $ | 4,311,175 | $ | 4,417,935 | $ | 4,757,076 | $ | 3,340,613 | $ | 3,390,771 | |||||||||
| Total liabilities | $ | 5,099,563 | $ | 5,101,512 | $ | 5,314,879 | $ | 3,791,922 | $ | 3,845,308 | |||||||||
| Quarter Ended | ||||||||||||||
| 6/30/2021 | 3/31/2021 | 12/31/2020 | 9/30/2020 | 6/30/2020 | ||||||||||
| Operating Information* | ||||||||||||||
| Properties | 569 | 562 | 552 | 432 | 426 | |||||||||
| Manufactured home sites | 97,448 | 96,876 | 96,688 | 95,209 | 94,232 | |||||||||
| Annual RV sites | 28,807 | 28,441 | 27,564 | 26,817 | 26,240 | |||||||||
| Transient RV sites | 27,032 | 26,295 | 25,043 | 23,728 | 22,360 | |||||||||
| Total sites | 153,287 | 151,612 | 149,295 | 145,754 | 142,832 | |||||||||
| Marina wet slips and dry storage spaces | 41,275 | 38,753 | 38,152 | N/A | N/A | |||||||||
| MH occupancy | 96.7 | % | 96.5 | % | 96.6 | % | 96.4 | % | 96.5 | % | ||||
| Annual RV occupancy | 100.0 | % | 100.0 | % | 100.0 | % | 100.0 | % | 100.0 | % | ||||
| Blended MH and annual RV occupancy | 97.4 | % | 97.3 | % | 97.3 | % | 97.2 | % | 97.3 | % | ||||
| New home sales | 227 | 149 | 156 | 155 | 140 | |||||||||
| Pre-owned home sales | 931 | 686 | 626 | 555 | 471 | |||||||||
| Total home sales | 1,158 | 835 | 782 | 710 | 611 | |||||||||
| Quarter Ended | ||||||||||
| 6/30/2021 | 3/31/2021 | 12/31/2020 | 9/30/2020 | 6/30/2020 | ||||||
| Revenue Producing Site Gains(5) | ||||||||||
| MH net leased sites | 226 | 127 | 247 | 349 | 759 | |||||
| RV net leased sites | 357 | 387 | 331 | 427 | 92 | |||||
| Total net leased sites | 583 | 514 | 578 | 776 | 851 | |||||
Consolidated Balance Sheets
(amounts in thousands)
| June 30, 2021 | December 31, 2020 | |||||||||
| Assets | ||||||||||
| Land | $ | 2,412,629 | $ | 2,119,364 | ||||||
| Land improvements and buildings | 8,995,041 | 8,480,597 | ||||||||
| Rental homes and improvements | 622,397 | 637,603 | ||||||||
| Furniture, fixtures and equipment | 529,549 | 447,039 | ||||||||
| Investment property | 12,559,616 | 11,684,603 | ||||||||
| Accumulated depreciation | (2,165,564 | ) | (1,968,812 | ) | ||||||
| Investment property, net | 10,394,052 | 9,715,791 | ||||||||
| Cash, cash equivalents and restricted cash | 119,612 | 92,641 | ||||||||
| Marketable securities | 153,049 | 124,726 | ||||||||
| Inventory of manufactured homes | 43,686 | 46,643 | ||||||||
| Notes and other receivables, net | 262,333 | 221,650 | ||||||||
| Goodwill | 448,317 | 428,833 | ||||||||
| Other intangible assets, net | 295,663 | 305,611 | ||||||||
| Other assets, net | 324,278 | 270,691 | ||||||||
| Total Assets | $ | 12,040,990 | $ | 11,206,586 | ||||||
| Liabilities | ||||||||||
| Secured debt | $ | 3,457,734 | $ | 3,489,983 | ||||||
| Unsecured debt | 853,441 | 1,267,093 | ||||||||
| Distributions payable | 98,429 | 86,988 | ||||||||
| Advanced reservation deposits and rent | 290,913 | 187,730 | ||||||||
| Accrued expenses and accounts payable | 214,200 | 148,435 | ||||||||
| Other liabilities | 184,846 | 134,650 | ||||||||
| Total Liabilities | 5,099,563 | 5,314,879 | ||||||||
| Commitments and contingencies | ||||||||||
| Temporary equity | 285,603 | 264,379 | ||||||||
| Stockholders’ Equity | ||||||||||
| Common stock | 1,159 | 1,076 | ||||||||
| Additional paid-in capital | 8,163,095 | 7,087,658 | ||||||||
| Accumulated other comprehensive income | 5,197 | 3,178 | ||||||||
| Distributions in excess of accumulated earnings | (1,614,243 | ) | (1,566,636 | ) | ||||||
| Total Sun Communities, Inc. stockholders’ equity | 6,555,208 | 5,525,276 | ||||||||
| Noncontrolling interests | ||||||||||
| Common and preferred OP units | 82,865 | 85,968 | ||||||||
| Consolidated variable interest entities | 17,751 | 16,084 | ||||||||
| Total noncontrolling interests | 100,616 | 102,052 | ||||||||
| Total Stockholders’ Equity | 6,655,824 | 5,627,328 | ||||||||
| Total Liabilities, Temporary Equity and Stockholders’ Equity | $ | 12,040,990 | $ | 11,206,586 | ||||||
Statements of Operations – Quarter to Date and Year to Date Comparison
(In thousands, except per share amounts) (Unaudited)
| Three Months Ended | Six Months Ended | ||||||||||||||||||||||||||||||||||||
| June 30, 2021 | June 30, 2020 | Change | % Change | June 30, 2021 | June 30, 2020 | Change | % Change | ||||||||||||||||||||||||||||||
| Revenues | |||||||||||||||||||||||||||||||||||||
| Real property (excluding transient) | $ | 328,907 | $ | 225,413 | $ | 103,494 | 45.9 | % | $ | 626,984 | $ | 453,415 | $ | 173,569 | 38.3 | % | |||||||||||||||||||||
| Real property – transient | 76,998 | 25,714 | 51,284 | 199.4 | % | 109,534 | 56,061 | 53,473 | 95.4 | % | |||||||||||||||||||||||||||
| Home sales | 81,848 | 38,530 | 43,318 | 112.4 | % | 134,047 | 79,117 | 54,930 | 69.4 | % | |||||||||||||||||||||||||||
| Service, retail, dining and entertainment | 106,452 | 7,700 | 98,752 | N/M | 157,064 | 12,803 | 144,261 | N/M | |||||||||||||||||||||||||||||
| Interest | 2,719 | 2,635 | 84 | 3.2 | % | 5,350 | 4,985 | 365 | 7.3 | % | |||||||||||||||||||||||||||
| Brokerage commissions and other, net | 6,939 | 3,274 | 3,665 | 111.9 | % | 12,899 | 7,187 | 5,712 | 79.5 | % | |||||||||||||||||||||||||||
| Total Revenues | 603,863 | 303,266 | 300,597 | 99.1 | % | 1,045,878 | 613,568 | 432,310 | 70.5 | % | |||||||||||||||||||||||||||
| Expenses | |||||||||||||||||||||||||||||||||||||
| Property operating and maintenance | 129,961 | 70,804 | 59,157 | 83.6 | % | 233,514 | 140,638 | 92,876 | 66.0 | % | |||||||||||||||||||||||||||
| Real estate tax | 23,202 | 17,723 | 5,479 | 30.9 | % | 45,610 | 34,899 | 10,711 | 30.7 | % | |||||||||||||||||||||||||||
| Home costs and selling | 58,763 | 32,051 | 26,712 | 83.3 | % | 100,353 | 66,090 | 34,263 | 51.8 | % | |||||||||||||||||||||||||||
| Service, retail, dining and entertainment | 78,585 | 7,242 | 71,343 | N/M | 124,016 | 13,924 | 110,092 | N/M | |||||||||||||||||||||||||||||
| General and administrative | 45,127 | 26,527 | 18,600 | 70.1 | % | 83,330 | 51,876 | 31,454 | 60.6 | % | |||||||||||||||||||||||||||
| Catastrophic event-related charges, net | 355 | (566 | ) | 921 | 162.7 | % | 2,769 | 40 | 2,729 | N/M | |||||||||||||||||||||||||||
| Business combination, net | (201 | ) | — | (201 | ) | N/A | 1,031 | — | 1,031 | N/A | |||||||||||||||||||||||||||
| Depreciation and amortization | 126,423 | 87,265 | 39,158 | 44.9 | % | 249,727 | 170,954 | 78,773 | 46.1 | % | |||||||||||||||||||||||||||
| Loss on extinguishment of debt | 8,108 | 1,930 | 6,178 | 320.1 | % | 8,108 | 5,209 | 2,899 | 55.7 | % | |||||||||||||||||||||||||||
| Interest | 37,681 | 31,428 | 6,253 | 19.9 | % | 77,198 | 63,844 | 13,354 | 20.9 | % | |||||||||||||||||||||||||||
| Interest on mandatorily redeemable preferred OP units / equity | 1,041 | 1,042 | (1 | ) | (0.1 | ) | % | 2,077 | 2,083 | (6 | ) | (0.3 | ) | % | |||||||||||||||||||||||
| Total Expenses | 509,045 | 275,446 | 233,599 | 84.8 | % | 927,733 | 549,557 | 378,176 | 68.8 | % | |||||||||||||||||||||||||||
| Income Before Other Items | 94,818 | 27,820 | 66,998 | 240.8 | % | 118,145 | 64,011 | 54,134 | 84.6 | % | |||||||||||||||||||||||||||
| Gain / (loss) on remeasurement of marketable securities | 27,494 | 24,519 | 2,975 | 12.1 | % | 31,155 | (4,128 | ) | 35,283 | N/M | |||||||||||||||||||||||||||
| Gain / (loss) on foreign currency translation | (264 | ) | 10,374 | (10,638 | ) | (102.5 | ) | % | (239 | ) | (7,105 | ) | 6,866 | (96.6 | ) | % | |||||||||||||||||||||
| Other expense, net(6) | (660 | ) | (821 | ) | 161 | 19.6 | % | (1,759 | ) | (1,793 | ) | 34 | (1.9 | ) | % | ||||||||||||||||||||||
| Gain / (loss) on remeasurement of notes receivable | 93 | 246 | (153 | ) | (62.2 | ) | % | 469 | (1,866 | ) | 2,335 | N/M | |||||||||||||||||||||||||
| Income from nonconsolidated affiliates | 794 | 92 | 702 | N/M | 1,965 | 144 | 1,821 | N/M | |||||||||||||||||||||||||||||
| Gain / (loss) on remeasurement of investment in nonconsolidated affiliates | (115 | ) | 1,132 | (1,247 | ) | (110.2 | ) | % | (11 | ) | (1,059 | ) | 1,048 | (99.0 | ) | % | |||||||||||||||||||||
| Current tax expense | (1,245 | ) | (119 | ) | (1,126 | ) | N/M | (1,016 | ) | (569 | ) | (447 | ) | 78.6 | % | ||||||||||||||||||||||
| Deferred tax benefit / (expense) | (66 | ) | 112 | (178 | ) | N/M | 81 | 242 | (161 | ) | (66.5 | ) | % | ||||||||||||||||||||||||
| Net Income | 120,849 | 63,355 | 57,494 | 90.7 | % | 148,790 | 47,877 | 100,913 | 210.8 | % | |||||||||||||||||||||||||||
| Less: Preferred return to preferred OP units / equity | 3,035 | 1,584 | 1,451 | 91.6 | % | 5,899 | 3,154 | 2,745 | 87.0 | % | |||||||||||||||||||||||||||
| Less: Income attributable to noncontrolling interests | 7,044 | 2,861 | 4,183 | 146.2 | % | 7,339 | 1,899 | 5,440 | 286.5 | % | |||||||||||||||||||||||||||
| Net Income Attributable to Sun Communities, Inc. | $ | 110,770 | $ | 58,910 | $ | 51,860 | 88.0 | % | $ | 135,552 | $ | 42,824 | $ | 92,728 | 216.5 | % | |||||||||||||||||||||
| Weighted average common shares outstanding – basic | 112,082 | 95,859 | 16,223 | 16.9 | % | 110,007 | 94,134 | 15,873 | 16.9 | % | |||||||||||||||||||||||||||
| Weighted average common shares outstanding – diluted | 112,082 | 95,860 | 16,222 | 16.9 | % | 112,593 | 94,525 | 18,068 | 19.1 | % | |||||||||||||||||||||||||||
| Basic earnings per share | $ | 0.98 | $ | 0.61 | $ | 0.37 | 60.7 | % | $ | 1.22 | $ | 0.45 | $ | 0.77 | 171.1 | % | |||||||||||||||||||||
| Diluted earnings per share | $ | 0.98 | $ | 0.61 | $ | 0.37 | 60.7 | % | $ | 1.22 | $ | 0.45 | $ | 0.77 | 171.1 | % | |||||||||||||||||||||
N/M = Percentage change is not meaningful.
Outstanding Securities and Capitalization
(amounts in thousands except for *)
| Outstanding Securities – As of June 30, 2021 | |||||||||||
| Number of Units / Shares Outstanding | Conversion Rate* | If Converted(1) | Issuance Price Per Unit* | Annual Distribution Rate* | |||||||
| Non-convertible Securities | |||||||||||
| Common shares | 115,889 | N/A | N/A | N/A | $3.32^ | ||||||
| Convertible Securities | |||||||||||
| Common OP units | 2,569 | 1.0000 | 2,569 | N/A | Mirrors common shares distributions | ||||||
| Series A-1 preferred OP units | 288 | 2.4390 | 703 | $ | 100 | 6.00 | % | ||||
| Series A-3 preferred OP units | 40 | 1.8605 | 75 | $ | 100 | 4.50 | % | ||||
| Series C preferred OP units | 306 | 1.1100 | 340 | $ | 100 | 5.00 | % | ||||
| Series D preferred OP units | 489 | 0.8000 | 391 | $ | 100 | 4.00 | % | ||||
| Series E preferred OP units | 90 | 0.6897 | 62 | $ | 100 | 5.25 | % | ||||
| Series F preferred OP units | 90 | 0.6250 | 56 | $ | 100 | 3.00 | % | ||||
| Series G preferred OP units | 241 | 0.6452 | 155 | $ | 100 | 3.20 | % | ||||
| Series H preferred OP units | 581 | 0.6098 | 355 | $ | 100 | 3.00 | % | ||||
| Series I preferred OP units | 922 | 0.6098 | 562 | $ | 100 | 3.00 | % | ||||
| Series J preferred OP units | 240 | 0.6061 | 145 | $ | 100 | 2.85 | % | ||||
^ Annual distribution is based on the last quarterly distribution annualized.
(1) Calculation may yield minor differences due to fractional shares paid in cash to the stockholder at conversion.
| Capitalization – As of June 30, 2021 | |||||||||||
| Equity | Shares | Share Price* | Total | ||||||||
| Common shares | 115,889 | $ | 171.40 | $ | 19,863,375 | ||||||
| Common OP units | 2,569 | $ | 171.40 | 440,327 | |||||||
| Subtotal | 118,458 | $ | 20,303,702 | ||||||||
| Preferred OP units as converted | 2,844 | $ | 171.40 | 487,462 | |||||||
| Total diluted shares outstanding | 121,302 | $ | 20,791,164 | ||||||||
| Debt | |||||||||||
| Secured debt | $ | 3,457,734 | |||||||||
| Unsecured debt | 853,441 | ||||||||||
| Total debt | $ | 4,311,175 | |||||||||
| Total Capitalization | $ | 25,102,339 | |||||||||
Reconciliations to Non-GAAP Financial Measures
Reconciliation of Net Income Attributable to Sun Communities, Inc. Common Stockholders to FFO(1)
(amounts in thousands except for per share data)
| Three Months Ended | Six Months Ended | ||||||||||||||||||
| June 30, 2021 | June 30, 2020 | June 30, 2021 | June 30, 2020 | ||||||||||||||||
| Net Income Attributable to Sun Communities, Inc. Common Stockholders | $ | 110,770 | $ | 58,910 | $ | 135,552 | $ | 42,824 | |||||||||||
| Adjustments | |||||||||||||||||||
| Depreciation and amortization | 126,227 | 87,296 | 249,303 | 171,048 | |||||||||||||||
| Depreciation on nonconsolidated affiliates | 31 | 19 | 61 | 19 | |||||||||||||||
| (Gain) / loss on remeasurement of marketable securities | (27,494 | ) | (24,519 | ) | (31,155 | ) | 4,128 | ||||||||||||
| (Gain) / loss on remeasurement of investment in nonconsolidated affiliates | 115 | (1,132 | ) | 11 | 1,059 | ||||||||||||||
| (Gain) / loss on remeasurement of notes receivable | (93 | ) | (246 | ) | (469 | ) | 1,866 | ||||||||||||
| Income attributable to noncontrolling interests | 5,033 | 1,942 | 4,886 | 1,646 | |||||||||||||||
| Preferred return to preferred OP units | 478 | — | 958 | 1,000 | |||||||||||||||
| Interest expense on Aspen preferred OP units | 514 | — | 1,028 | — | |||||||||||||||
| Gain on disposition of assets, net | (17,564 | ) | (4,178 | ) | (25,719 | ) | (9,740 | ) | |||||||||||
| FFO Attributable to Sun Communities, Inc. Common Stockholders and Dilutive Convertible Securities(1)(4) | $ | 198,017 | $ | 118,092 | $ | 334,456 | $ | 213,850 | |||||||||||
| Adjustments | |||||||||||||||||||
| Business combination expense and other acquisition related costs(7) | 2,284 | 504 | 4,237 | 889 | |||||||||||||||
| Loss on extinguishment of debt | 8,108 | 1,930 | 8,108 | 5,209 | |||||||||||||||
| Catastrophic event-related charges, net | 364 | (567 | ) | 2,778 | 39 | ||||||||||||||
| Loss of earnings – catastrophic event-related | — | — | 200 | 300 | |||||||||||||||
| (Gain) / loss on foreign currency translation | 264 | (10,374 | ) | 239 | 7,105 | ||||||||||||||
| Other expense, net | 517 | 552 | 1,233 | 854 | |||||||||||||||
| Deferred tax (benefits) / expenses | 66 | 188 | (81 | ) | 58 | ||||||||||||||
| Core FFO Attributable to Sun Communities, Inc. Common Stockholders and Dilutive Convertible Securities(1)(4) | $ | 209,620 | $ | 110,325 | $ | 351,170 | $ | 228,304 | |||||||||||
| Weighted average common shares outstanding – basic | 112,082 | 95,859 | 110,007 | 94,134 | |||||||||||||||
| Add | |||||||||||||||||||
| Common stock issuable upon conversion of stock options | — | 1 | — | 1 | |||||||||||||||
| Restricted stock | 580 | 305 | 372 | 390 | |||||||||||||||
| Common OP units | 2,577 | 2,448 | 2,586 | 2,430 | |||||||||||||||
| Common stock issuable upon conversion of certain preferred OP units | 1,174 | — | 1,180 | 815 | |||||||||||||||
| Weighted Average Common Shares Outstanding – Fully Diluted | 116,413 | 98,613 | 114,145 | 97,770 | |||||||||||||||
| FFO Attributable to Sun Communities, Inc. Common Stockholders and Dilutive Convertible Securities(1)(4) Per Share – Fully Diluted | $ | 1.70 | $ | 1.20 | $ | 2.93 | $ | 2.19 | |||||||||||
| Core FFO Attributable to Sun Communities, Inc. Common Stockholders and Dilutive Convertible Securities(1)(4) Per Share – Fully Diluted | $ | 1.80 | $ | 1.12 | $ | 3.08 | $ | 2.34 | |||||||||||
Reconciliation of Net Income Attributable to Sun Communities, Inc. Common Stockholders to NOI(1)
(amounts in thousands)
| Three Months Ended | Six Months Ended | ||||||||||||||||||
| June 30, 2021 | June 30, 2020 | June 30, 2021 | June 30, 2020 | ||||||||||||||||
| Net Income Attributable to Sun Communities, Inc. Common Stockholders | $ | 110,770 | $ | 58,910 | $ | 135,552 | $ | 42,824 | |||||||||||
| Interest income | (2,719 | ) | (2,635 | ) | (5,350 | ) | (4,985 | ) | |||||||||||
| Brokerage commissions and other revenues, net | (6,939 | ) | (3,274 | ) | (12,899 | ) | (7,187 | ) | |||||||||||
| General and administrative expense | 45,127 | 26,527 | 83,330 | 51,876 | |||||||||||||||
| Catastrophic event-related charges, net | 355 | (566 | ) | 2,769 | 40 | ||||||||||||||
| Business combination expense, net | (201 | ) | — | 1,031 | — | ||||||||||||||
| Depreciation and amortization | 126,423 | 87,265 | 249,727 | 170,954 | |||||||||||||||
| Loss on extinguishment of debt | 8,108 | 1,930 | 8,108 | 5,209 | |||||||||||||||
| Interest expense | 37,681 | 31,428 | 77,198 | 63,844 | |||||||||||||||
| Interest on mandatorily redeemable preferred OP units / equity | 1,041 | 1,042 | 2,077 | 2,083 | |||||||||||||||
| (Gain) / loss on remeasurement of marketable securities | (27,494 | ) | (24,519 | ) | (31,155 | ) | 4,128 | ||||||||||||
| (Gain) / loss on foreign currency translation | 264 | (10,374 | ) | 239 | 7,105 | ||||||||||||||
| Other expense, net(6) | 660 | 821 | 1,759 | 1,793 | |||||||||||||||
| (Gain) / loss on remeasurement of notes receivable | (93 | ) | (246 | ) | (469 | ) | 1,866 | ||||||||||||
| Income from nonconsolidated affiliates | (794 | ) | (92 | ) | (1,965 | ) | (144 | ) | |||||||||||
| (Gain) / loss on remeasurement of investment in nonconsolidated affiliates | 115 | (1,132 | ) | 11 | 1,059 | ||||||||||||||
| Current tax expense | 1,245 | 119 | 1,016 | 569 | |||||||||||||||
| Deferred tax (benefit) / expense | 66 | (112 | ) | (81 | ) | (242 | ) | ||||||||||||
| Preferred return to preferred OP units / equity | 3,035 | 1,584 | 5,899 | 3,154 | |||||||||||||||
| Income attributable to noncontrolling interests | 7,044 | 2,861 | 7,339 | 1,899 | |||||||||||||||
| NOI(1) | $ | 303,694 | $ | 169,537 | $ | 524,136 | $ | 345,845 | |||||||||||
| Three Months Ended | Six Months Ended | |||||||||||||||
| June 30, 2021 | June 30, 2020 | June 30, 2021 | June 30, 2020 | |||||||||||||
| Real Property NOI(1) | $ | 252,742 | $ | 162,600 | $ | 457,394 | $ | 333,939 | ||||||||
| Home Sales NOI(1) | 23,085 | 6,479 | 33,694 | 13,027 | ||||||||||||
| Service, retail, dining and entertainment NOI(1) | 27,867 | 458 | 33,048 | (1,121 | ) | |||||||||||
| NOI(1) | $ | 303,694 | $ | 169,537 | $ | 524,136 | $ | 345,845 | ||||||||
Reconciliation of Net Income Attributable to Sun Communities, Inc. Common Stockholders to Recurring EBITDA(1)
(amounts in thousands)
| Three Months Ended | Six Months Ended | ||||||||||||||||||
| June 30, 2021 | June 30, 2020 | June 30, 2021 | June 30, 2020 | ||||||||||||||||
| Net Income Attributable to Sun Communities, Inc. Common Stockholders | $ | 110,770 | $ | 58,910 | $ | 135,552 | $ | 42,824 | |||||||||||
| Adjustments | |||||||||||||||||||
| Depreciation and amortization | 126,423 | 87,265 | 249,727 | 170,954 | |||||||||||||||
| Loss on extinguishment of debt | 8,108 | 1,930 | 8,108 | 5,209 | |||||||||||||||
| Interest expense | 37,681 | 31,428 | 77,198 | 63,844 | |||||||||||||||
| Interest on mandatorily redeemable preferred OP units / equity | 1,041 | 1,042 | 2,077 | 2,083 | |||||||||||||||
| Current tax expense | 1,245 | 119 | 1,016 | 569 | |||||||||||||||
| Deferred tax (benefit) / expense | 66 | (112 | ) | (81 | ) | (242 | ) | ||||||||||||
| Income from nonconsolidated affiliates | (794 | ) | (92 | ) | (1,965 | ) | (144 | ) | |||||||||||
| Less: Gain on dispositions of assets, net | (17,564 | ) | (4,178 | ) | (25,719 | ) | (9,740 | ) | |||||||||||
| EBITDAre(1) | $ | 266,976 | $ | 176,312 | $ | 445,913 | $ | 275,357 | |||||||||||
| Adjustments | |||||||||||||||||||
| Catastrophic event-related charges, net | 355 | (566 | ) | 2,769 | 40 | ||||||||||||||
| Business combination expense | (201 | ) | — | 1,031 | — | ||||||||||||||
| (Gain) / loss on remeasurement of marketable securities | (27,494 | ) | (24,519 | ) | (31,155 | ) | 4,128 | ||||||||||||
| (Gain) / loss on foreign currency translation | 264 | (10,374 | ) | 239 | 7,105 | ||||||||||||||
| Other expense, net(6) | 660 | 821 | 1,759 | 1,793 | |||||||||||||||
| (Gain) / loss on remeasurement of notes receivable | (93 | ) | (246 | ) | (469 | ) | 1,866 | ||||||||||||
| (Gain) / loss on remeasurement of investment in nonconsolidated affiliates | 115 | (1,132 | ) | 11 | 1,059 | ||||||||||||||
| Preferred return to preferred OP units / equity | 3,035 | 1,584 | 5,899 | 3,154 | |||||||||||||||
| Income attributable to noncontrolling interests | 7,044 | 2,861 | 7,339 | 1,899 | |||||||||||||||
| Plus: Gain on dispositions of assets, net | 17,564 | 4,178 | 25,719 | 9,740 | |||||||||||||||
| Recurring EBITDA(1) | $ | 268,225 | $ | 148,919 | $ | 459,055 | $ | 306,141 | |||||||||||
Non-GAAP and Other Financial Measures
Debt Analysis
(amounts in thousands)
| Quarter Ended | |||||||||||||||||||
| 6/30/2021 | 3/31/2021 | 12/31/2020 | 9/30/2020 | 6/30/2020 | |||||||||||||||
| Debt Outstanding | |||||||||||||||||||
| Mortgage term loans | $ | 3,418,097 | $ | 3,430,420 | $ | 3,444,967 | $ | 3,191,380 | $ | 3,205,507 | |||||||||
| Collateralized term loan | 39,637 | 42,510 | 45,016 | 47,546 | 50,006 | ||||||||||||||
| Total secured debt | 3,457,734 | 3,472,930 | 3,489,983 | 3,238,926 | 3,255,513 | ||||||||||||||
| Senior unsecured notes | 591,688 | — | — | — | — | ||||||||||||||
| Line of credit and other debt | 191,841 | 875,093 | 1,197,181 | 31,775 | 65,346 | ||||||||||||||
| Preferred Equity – Sun NG Resorts – mandatorily redeemable | 35,249 | 35,249 | 35,249 | 35,249 | 35,249 | ||||||||||||||
| Preferred OP units – mandatorily redeemable | 34,663 | 34,663 | 34,663 | 34,663 | 34,663 | ||||||||||||||
| Total unsecured debt | 853,441 | 945,005 | 1,267,093 | 101,687 | 135,258 | ||||||||||||||
| Total debt | $ | 4,311,175 | $ | 4,417,935 | $ | 4,757,076 | $ | 3,340,613 | $ | 3,390,771 | |||||||||
| % Fixed / Floating | |||||||||||||||||||
| Fixed | 94.7 | % | 79.3 | % | 74.0 | % | 97.6 | % | 96.6 | % | |||||||||
| Floating | 5.3 | % | 20.7 | % | 26.0 | % | 2.4 | % | 3.4 | % | |||||||||
| Total | 100.0 | % | 100.0 | % | 100.0 | % | 100.0 | % | 100.0 | % | |||||||||
| Weighted Average Interest Rates | |||||||||||||||||||
| Mortgage term loans | 3.78 | % | 3.78 | % | 3.78 | % | 3.88 | % | 3.88 | % | |||||||||
| Collateralized term loan | 1.30 | % | 1.29 | % | 1.31 | % | 1.31 | % | 1.31 | % | |||||||||
| Senior unsecured notes | 2.70 | % | — | % | — | % | — | % | — | % | |||||||||
| Line of credit and other debt(8) | 0.93 | % | 1.77 | % | 2.11 | % | 1.34 | % | 2.57 | % | |||||||||
| Preferred Equity – Sun NG Resorts – mandatorily redeemable | 6.00 | % | 6.00 | % | 6.00 | % | 6.00 | % | 6.00 | % | |||||||||
| Preferred OP units – mandatorily redeemable | 5.93 | % | 5.93 | % | 5.93 | % | 5.93 | % | 5.93 | % | |||||||||
| Total average | 3.52 | % | 3.39 | % | 3.37 | % | 3.86 | % | 3.86 | % | |||||||||
| Debt Ratios | |||||||||||||||||||
| Net Debt / Recurring EBITDA(1) (TTM) | 5.1 | 6.1 | 6.9 | 5.0 | 4.8 | ||||||||||||||
| Net Debt / Enterprise Value | 16.8 | % | 19.7 | % | 21.4 | % | 18.3 | % | 17.8 | % | |||||||||
| Net Debt / Gross Assets | 29.6 | % | 31.8 | % | 35.5 | % | 31.6 | % | 29.7 | % | |||||||||
| Coverage Ratios | |||||||||||||||||||
| Recurring EBITDA(1) (TTM) / Interest | 5.6 | 5.0 | 4.9 | 4.8 | 4.5 | ||||||||||||||
| Recurring EBITDA(1) (TTM) / Interest + Pref. Distributions + Pref. Stock Distribution | 5.5 | 4.8 | 4.8 | 4.6 | 4.4 | ||||||||||||||
| Maturities / Principal Amortization Next Five Years | 2021 | 2022 | 2023 | 2024 | 2025 | ||||||||||||||
| Mortgage term loans | |||||||||||||||||||
| Maturities | $ | — | $ | 82,155 | $ | 185,619 | $ | 315,330 | $ | 50,529 | |||||||||
| Principal amortization | 30,083 | 61,411 | 60,788 | 57,344 | 53,933 | ||||||||||||||
| Collateralized term loan | 4,621 | 10,000 | 25,016 | — | — | ||||||||||||||
| Line of credit and other debt | — | 1,509 | — | — | 190,332 | ||||||||||||||
| Preferred Equity – Sun NG Resorts – mandatorily redeemable | — | — | — | 33,428 | 1,821 | ||||||||||||||
| Preferred OP units – mandatorily redeemable | — | — | — | 27,373 | — | ||||||||||||||
| Total | $ | 34,704 | $ | 155,075 | $ | 271,423 | $ | 433,475 | $ | 296,615 | |||||||||
| Weighted average rate of maturities | — | % | 4.46 | % | 4.08 | % | 4.47 | % | 4.04 | % | |||||||||
Same Community(2)
(amounts in thousands)
| Three Months Ended | ||||||||||||||||||||||||||||||||||||||||||||
| Total Same Community | MH | RV | ||||||||||||||||||||||||||||||||||||||||||
| June 30, 2021 | June 30, 2020 | Change | % Change | June 30, 2021 | June 30, 2020 | Change | % Change | June 30, 2021 | June 30, 2020 | Change | % Change | |||||||||||||||||||||||||||||||||
| Financial Information | ||||||||||||||||||||||||||||||||||||||||||||
| Revenue | ||||||||||||||||||||||||||||||||||||||||||||
| Real property (excluding transient) | $ | 219,693 | $ | 205,449 | $ | 14,244 | 6.9 | % | $ | 174,158 | $ | 166,473 | $ | 7,685 | 4.6 | % | $ | 45,535 | $ | 38,976 | $ | 6,559 | 16.8 | % | ||||||||||||||||||||
| Real property – transient | 51,481 | 21,510 | 29,971 | 139.3 | % | 362 | 173 | 189 | 109.2 | % | 51,119 | 21,337 | 29,782 | 139.6 | % | |||||||||||||||||||||||||||||
| Other | 10,798 | 3,219 | 7,579 | 235.4 | % | 4,869 | 1,130 | 3,739 | 330.9 | % | 5,929 | 2,089 | 3,840 | 183.8 | % | |||||||||||||||||||||||||||||
| Total Operating | 281,972 | 230,178 | 51,794 | 22.5 | % | 179,389 | 167,776 | 11,613 | 6.9 | % | 102,583 | 62,402 | 40,181 | 64.4 | % | |||||||||||||||||||||||||||||
| Expense | ||||||||||||||||||||||||||||||||||||||||||||
| Property Operating(9)(10) | 87,459 | 70,159 | 17,300 | 24.7 | % | 44,984 | 40,226 | 4,758 | 11.8 | % | 42,475 | 29,933 | 12,542 | 41.9 | % | |||||||||||||||||||||||||||||
| Real Property NOI(1) | $ | 194,513 | $ | 160,019 | $ | 34,494 | 21.6 | % | $ | 134,405 | $ | 127,550 | $ | 6,855 | 5.4 | % | $ | 60,108 | $ | 32,469 | $ | 27,639 | 85.1 | % | ||||||||||||||||||||
| Six Months Ended | ||||||||||||||||||||||||||||||||||||||||||||||
| Total Same Community | MH | RV | ||||||||||||||||||||||||||||||||||||||||||||
| June 30, 2021 | June 30, 2020 | Change | % Change | June 30, 2021 | June 30, 2020 | Change | % Change | June 30, 2021 | June 30, 2020 | Change | % Change | |||||||||||||||||||||||||||||||||||
| Financial Information | ||||||||||||||||||||||||||||||||||||||||||||||
| Revenue | ||||||||||||||||||||||||||||||||||||||||||||||
| Real property (excluding Transient) | $ | 435,054 | $ | 410,667 | $ | 24,387 | 5.9 | % | $ | 346,900 | $ | 331,301 | $ | 15,599 | 4.7 | % | $ | 88,154 | $ | 79,366 | $ | 8,788 | 11.1 | % | ||||||||||||||||||||||
| Real property – transient | 76,883 | 49,869 | 27,014 | 54.2 | % | 962 | 1,101 | (139 | ) | (12.6 | ) | % | 75,921 | 48,768 | 27,153 | 55.7 | % | |||||||||||||||||||||||||||||
| Other | 17,793 | 9,071 | 8,722 | 96.2 | % | 9,695 | 4,940 | 4,755 | 96.3 | % | 8,098 | 4,131 | 3,967 | 96.0 | % | |||||||||||||||||||||||||||||||
| Total Operating | 529,730 | 469,607 | 60,123 | 12.8 | % | 357,557 | 337,342 | 20,215 | 6.0 | % | 172,173 | 132,265 | 39,908 | 30.2 | % | |||||||||||||||||||||||||||||||
| Expense | ||||||||||||||||||||||||||||||||||||||||||||||
| Property Operating(9)(10) | 159,973 | 138,879 | 21,094 | 15.2 | % | 87,989 | 80,911 | 7,078 | 8.7 | % | 71,984 | 57,968 | 14,016 | 24.2 | % | |||||||||||||||||||||||||||||||
| Real Property NOI(1) | $ | 369,757 | $ | 330,728 | $ | 39,029 | 11.8 | % | $ | 269,568 | $ | 256,431 | $ | 13,137 | 5.1 | % | $ | 100,189 | $ | 74,297 | $ | 25,892 | 34.8 | % | ||||||||||||||||||||||
Same Community(2) (continued)
| As of | ||||||||||||||
| June 30, 2021 | June 30, 2020 | Change | % Change | |||||||||||
| Other Information | ||||||||||||||
| Number of properties | 405 | 405 | — | |||||||||||
| MH occupancy | 97.4 | % | ||||||||||||
| RV occupancy | 100.0 | % | ||||||||||||
| MH & RV blended occupancy(3) | 98.0 | % | ||||||||||||
| Adjusted MH occupancy(3) | 98.5 | % | ||||||||||||
| Adjusted RV occupancy(3) | 100.0 | % | ||||||||||||
| Adjusted MH & RV blended occupancy(3) | 98.8 | % | 97.2 | % | 1.6 | % | ||||||||
| Sites available for development | 7,246 | 7,553 | (307 | ) | ||||||||||
| Monthly base rent per site – MH | $ | 601 | $ | 583 | $ | 18 | 3.1%(12) | |||||||
| Monthly base rent per site – RV(11) | $ | 527 | $ | 504 | $ | 23 | 4.7%(12) | |||||||
| Monthly base rent per site – Total(11) | $ | 584 | $ | 565 | $ | 19 | 3.3%(12) | |||||||
Marina Summary
(amounts in thousands except for statistical data)
| Three Months Ended | Six Months Ended | ||||||
| June 30, 2021 | June 30, 2021 | ||||||
| Financial Information | |||||||
| Revenues | |||||||
| Real property (excluding transient) | $ | 61,914 | $ | 108,020 | |||
| Real property – transient | 4,257 | 5,125 | |||||
| Other | 3,671 | 5,319 | |||||
| Total Operating | 69,842 | 118,464 | |||||
| Expenses | |||||||
| Property Operating(a) | 28,246 | 51,821 | |||||
| Real Property NOI | 41,596 | 66,643 | |||||
| Service, retail, dining and entertainment | |||||||
| Service, retail, dining and entertainment revenue | 82,238 | 126,592 | |||||
| Service, retail, dining and entertainment expense | 61,017 | 99,026 | |||||
| Service, Retail, Dining and Entertainment NOI | 21,221 | 27,566 | |||||
| Marina NOI | $ | 62,817 | $ | 94,209 | |||
| Other Information – Marinas | June 30, 2021 | ||||||
| Number of properties(b) | 114 | ||||||
| Total wet slips and dry storage | 41,275 | ||||||
(a) Marina results net $3.7 million and $6.3 million of certain utility revenue against the related utility expense in property operating and maintenance expense for the quarter and six months ended June 30, 2021.
(b) Marina properties comprised of eight properties acquired in 2021 and 106 properties acquired in 2020.
MH and RV Acquisitions and Other Summary(13)
(amounts in thousands except for statistical data)
| Three Months Ended | Six Months Ended | ||||||
| June 30, 2021 | June 30, 2021 | ||||||
| Financial Information | |||||||
| Revenues | |||||||
| Real property (excluding transient) | $ | 8,522 | $ | 15,820 | |||
| Real property – transient | 21,259 | 27,525 | |||||
| Other income | 2,767 | 3,122 | |||||
| Total Operating | 32,548 | 46,467 | |||||
| Expenses | |||||||
| Property Operating(a) | 15,915 | 25,475 | |||||
| Real Property NOI | $ | 16,633 | $ | 20,992 | |||
| Other Information – MH and RVs | June 30, 2021 | ||||||
| Number of properties | 50 | ||||||
| Occupied sites | 5,474 | ||||||
| Developed sites | 6,322 | ||||||
| Occupancy % | 86.6 | % | |||||
| Transient sites | 8,122 | ||||||
(a) MH and RV Acquisitions and Other results net $1.1 million and $2.3 million of certain utility revenue against the related utility expense in property operating and maintenance expense for the quarter and six months ended June 30, 2021.
Home Sales Summary
(amounts in thousands except for *)
| Three Months Ended | Six Months Ended | ||||||||||||||||||||||||||||
| June 30, 2021 | June 30, 2020 | Change | % Change | June 30, 2021 | June 30, 2020 | Change | % Change | ||||||||||||||||||||||
| Financial Information | |||||||||||||||||||||||||||||
| New Homes | |||||||||||||||||||||||||||||
| New home sales | $ | 34,761 | $ | 19,206 | $ | 15,555 | 81.0 | % | $ | 57,733 | $ | 34,802 | $ | 22,931 | 65.9 | % | |||||||||||||
| New home cost of sales | 28,269 | 15,707 | 12,562 | 80.0 | % | 46,943 | 28,317 | 18,626 | 65.8 | % | |||||||||||||||||||
| Gross Profit – new homes | 6,492 | 3,499 | 2,993 | 85.5 | % | 10,790 | 6,485 | 4,305 | 66.4 | % | |||||||||||||||||||
| Gross margin % – new homes | 18.7 | % | 18.2 | % | 0.5 | % | 18.7 | % | 18.6 | % | 0.1 | % | |||||||||||||||||
| Average selling price – new homes* | $ | 153,132 | $ | 137,186 | $ | 15,946 | 11.6 | % | $ | 153,545 | $ | 134,371 | $ | 19,174 | 14.3 | % | |||||||||||||
| Pre-owned Homes | |||||||||||||||||||||||||||||
| Pre-owned home sales | $ | 47,087 | $ | 19,324 | $ | 27,763 | 143.7 | % | $ | 76,314 | $ | 44,315 | $ | 31,999 | 72.2 | % | |||||||||||||
| Pre-owned home cost of sales | 25,945 | 13,474 | 12,471 | 92.6 | % | 44,529 | 30,896 | 13,633 | 44.1 | % | |||||||||||||||||||
| Gross Profit – pre-owned homes | 21,142 | 5,850 | 15,292 | 261.4 | % | 31,785 | 13,419 | 18,366 | 136.9 | % | |||||||||||||||||||
| Gross margin % – pre-owned homes | 44.9 | % | 30.3 | % | 14.6 | % | 41.7 | % | 30.3 | % | 11.4 | % | |||||||||||||||||
| Average selling price – pre-owned homes* | $ | 50,577 | $ | 41,028 | $ | 9,549 | 23.3 | % | $ | 47,195 | $ | 39,744 | $ | 7,451 | 18.7 | % | |||||||||||||
| Total Home Sales | |||||||||||||||||||||||||||||
| Revenue from home sales | $ | 81,848 | $ | 38,530 | $ | 43,318 | 112.4 | % | $ | 134,047 | $ | 79,117 | $ | 54,930 | 69.4 | % | |||||||||||||
| Cost of home sales | 54,214 | 29,181 | 25,033 | 85.8 | % | 91,472 | 59,213 | 32,259 | 54.5 | % | |||||||||||||||||||
| Home selling expenses | 4,549 | 2,870 | 1,679 | 58.5 | % | 8,881 | 6,877 | 2,004 | 29.1 | % | |||||||||||||||||||
| Home Sales NOI(1) | $ | 23,085 | $ | 6,479 | $ | 16,606 | 256.3 | % | $ | 33,694 | $ | 13,027 | $ | 20,667 | 158.6 | % | |||||||||||||
| Statistical Information | |||||||||||||||||||||||||||||
| New home sales volume* | 227 | 140 | 87 | 62.1 | % | 376 | 259 | 117 | 45.2 | % | |||||||||||||||||||
| Pre-owned home sales volume* | 931 | 471 | 460 | 97.7 | % | 1,617 | 1,115 | 502 | 45.0 | % | |||||||||||||||||||
| Total home sales volume* | 1,158 | 611 | 547 | 89.5 | % | 1,993 | 1,374 | 619 | 45.1 | % | |||||||||||||||||||
Rental Program Summary
(amounts in thousands except for *)
| Three Months Ended | Six Months Ended | ||||||||||||||||||||||||||||||
| June 30, 2021 | June 30, 2020 | Change | % Change | June 30, 2021 | June 30, 2020 | Change | % Change | ||||||||||||||||||||||||
| Financial Information | |||||||||||||||||||||||||||||||
| Revenues | |||||||||||||||||||||||||||||||
| Home rent | $ | 17,060 | $ | 14,968 | $ | 2,092 | 14.0 | % | $ | 34,082 | $ | 30,436 | $ | 3,646 | 12.0 | % | |||||||||||||||
| Site rent | 18,649 | 18,591 | 58 | 0.3 | % | 37,766 | 36,598 | 1,168 | 3.2 | % | |||||||||||||||||||||
| Total | 35,709 | 33,559 | 2,150 | 6.4 | % | 71,848 | 67,034 | 4,814 | 7.2 | % | |||||||||||||||||||||
| Expenses | |||||||||||||||||||||||||||||||
| Rental Program operating and maintenance | 4,561 | 4,425 | 136 | 3.1 | % | 9,785 | 9,248 | 537 | 5.8 | % | |||||||||||||||||||||
| Rental Program NOI(1) | $ | 31,148 | $ | 29,134 | $ | 2,014 | 6.9 | % | $ | 62,063 | $ | 57,786 | $ | 4,277 | 7.4 | % | |||||||||||||||
| Other Information | |||||||||||||||||||||||||||||||
| Number of sold rental homes* | 281 | 122 | 159 | 130.3 | % | 492 | 356 | 136 | 38.2 | % | |||||||||||||||||||||
| Number of occupied rentals, end of period* | 10,951 | 11,785 | (834 | ) | (7.1 | ) | % | ||||||||||||||||||||||||
| Investment in occupied rental homes, end of period | $ | 601,798 | $ | 621,327 | $ | (19,529 | ) | (3.1 | ) | % | |||||||||||||||||||||
| Weighted average monthly rental rate, end of period* | $ | 1,076 | $ | 1,018 | $ | 58 | 5.7 | % | |||||||||||||||||||||||
Rental Program NOI is included in Real Property NOI. Rental Program NOI is separately reviewed to assess the overall growth and performance of the Rental Program and its financial impact on the Company’s operations.
| MH and RV Property Summary | |||||||||||||||
| 6/30/2021 | 3/31/2021 | 12/31/2020 | 9/30/2020 | 6/30/2020 | |||||||||||
| FLORIDA | |||||||||||||||
| Properties | 129 | 128 | 128 | 127 | 125 | ||||||||||
| MH & Annual RV Developed sites(14) | 40,171 | 40,011 | 39,803 | 39,517 | 39,241 | ||||||||||
| Occupied MH & Annual RV(14) | 39,402 | 39,283 | 39,063 | 38,743 | 38,453 | ||||||||||
| MH & Annual RV Occupancy %(14) | 98.1 | % | 98.2 | % | 98.1 | % | 98.0 | % | 98.0 | % | |||||
| Transient RV sites | 5,895 | 5,823 | 6,011 | 5,993 | 5,547 | ||||||||||
| Sites for development | 1,414 | 1,497 | 1,497 | 1,427 | 1,427 | ||||||||||
| MICHIGAN | |||||||||||||||
| Properties | 75 | 74 | 74 | 74 | 72 | ||||||||||
| MH & Annual RV Developed sites(14) | 29,600 | 29,092 | 29,086 | 29,086 | 27,901 | ||||||||||
| Occupied MH & Annual RV(14) | 28,671 | 28,145 | 28,109 | 28,033 | 27,191 | ||||||||||
| MH & Annual RV Occupancy %(14) | 96.9 | % | 96.7 | % | 96.6 | % | 96.4 | % | 97.5 | % | |||||
| Transient RV sites | 509 | 541 | 546 | 546 | 572 | ||||||||||
| Sites for development | 1,182 | 1,182 | 1,182 | 1,182 | 1,182 | ||||||||||
| CALIFORNIA | |||||||||||||||
| Properties | 36 | 36 | 35 | 34 | 32 | ||||||||||
| MH & Annual RV Developed sites(14) | 6,736 | 6,734 | 6,675 | 6,372 | 6,364 | ||||||||||
| Occupied MH & Annual RV(14) | 6,613 | 6,609 | 6,602 | 6,290 | 6,272 | ||||||||||
| MH & Annual RV Occupancy %(14) | 98.2 | % | 98.1 | % | 98.9 | % | 98.7 | % | 98.6 | % | |||||
| Transient RV sites | 2,416 | 2,418 | 2,231 | 2,236 | 1,978 | ||||||||||
| Sites for development | 127 | 127 | 373 | 373 | 264 | ||||||||||
| TEXAS | |||||||||||||||
| Properties | 25 | 24 | 24 | 24 | 23 | ||||||||||
| MH & Annual RV Developed sites(14) | 7,947 | 7,928 | 7,766 | 7,659 | 7,641 | ||||||||||
| Occupied MH & Annual RV(14) | 7,731 | 7,671 | 7,572 | 7,427 | 7,289 | ||||||||||
| MH & Annual RV Occupancy %(14) | 97.3 | % | 96.8 | % | 97.5 | % | 97.0 | % | 95.4 | % | |||||
| Transient RV sites | 1,835 | 1,773 | 1,810 | 1,917 | 1,590 | ||||||||||
| Sites for development | 1,194 | 1,275 | 1,378 | 1,378 | 565 | ||||||||||
| ONTARIO, CANADA | |||||||||||||||
| Properties | 16 | 16 | 15 | 15 | 15 | ||||||||||
| MH & Annual RV Developed sites(14) | 4,302 | 4,199 | 4,090 | 4,067 | 3,980 | ||||||||||
| Occupied MH & Annual RV(14) | 4,302 | 4,199 | 4,090 | 4,067 | 3,980 | ||||||||||
| MH & Annual RV Occupancy %(14) | 100.0 | % | 100.0 | % | 100.0 | % | 100.0 | % | 100.0 | % | |||||
| Transient RV sites | 870 | 964 | 966 | 920 | 1,007 | ||||||||||
| Sites for development | 1,525 | 1,525 | 1,525 | 1,593 | 1,593 | ||||||||||
| CONNECTICUT | |||||||||||||||
| Properties | 16 | 16 | 16 | 16 | 16 | ||||||||||
| MH & Annual RV Developed sites(14) | 1,901 | 1,897 | 1,897 | 1,898 | 1,898 | ||||||||||
| Occupied MH & Annual RV(14) | 1,757 | 1,746 | 1,739 | 1,736 | 1,735 | ||||||||||
| MH & Annual RV Occupancy %(14) | 92.4 | % | 92.0 | % | 91.7 | % | 91.5 | % | 91.4 | % | |||||
| Transient RV sites | 104 | 108 | 108 | 107 | 107 | ||||||||||
| Sites for development | — | — | — | — | — | ||||||||||
| ARIZONA | |||||||||||||||
| Properties | 14 | 14 | 14 | 13 | 13 | ||||||||||
| MH & Annual RV Developed sites(14) | 4,401 | 4,391 | 4,323 | 4,274 | 4,259 | ||||||||||
| Occupied MH & Annual RV(14) | 4,116 | 4,101 | 4,030 | 3,957 | 3,932 | ||||||||||
| MH & Annual RV Occupancy %(14) | 93.5 | % | 93.4 | % | 93.2 | % | 92.6 | % | 92.3 | % | |||||
| Transient RV sites | 1,260 | 1,270 | 1,337 | 1,386 | 1,401 | ||||||||||
| Sites for development | — | — | — | — | — | ||||||||||
| MAINE | |||||||||||||||
| Properties | 13 | 13 | 13 | 7 | 7 | ||||||||||
| MH & Annual RV Developed sites(14) | 2,204 | 2,190 | 2,190 | 1,092 | 1,074 | ||||||||||
| Occupied MH & Annual RV(14) | 2,127 | 2,119 | 2,121 | 1,089 | 1,069 | ||||||||||
| MH & Annual RV Occupancy %(14) | 96.5 | % | 96.8 | % | 96.8 | % | 99.7 | % | 99.5 | % | |||||
| Transient RV sites | 792 | 805 | 805 | 819 | 837 | ||||||||||
| Sites for development | 30 | 30 | 30 | 30 | 30 | ||||||||||
| INDIANA | |||||||||||||||
| Properties | 12 | 12 | 12 | 11 | 11 | ||||||||||
| MH & Annual RV Developed sites(14) | 3,087 | 3,087 | 3,087 | 3,087 | 3,087 | ||||||||||
| Occupied MH & Annual RV(14) | 2,970 | 2,961 | 2,950 | 2,957 | 2,961 | ||||||||||
| MH & Annual RV Occupancy %(14) | 96.2 | % | 95.9 | % | 95.6 | % | 95.8 | % | 95.9 | % | |||||
| Transient RV sites | 1,089 | 1,089 | 1,089 | 534 | 534 | ||||||||||
| Sites for development | 277 | 277 | 277 | 277 | 277 | ||||||||||
| COLORADO | |||||||||||||||
| Properties | 10 | 10 | 10 | 10 | 10 | ||||||||||
| MH & Annual RV Developed sites(14) | 2,453 | 2,453 | 2,453 | 2,453 | 2,441 | ||||||||||
| Occupied MH & Annual RV(14) | 2,420 | 2,395 | 2,380 | 2,365 | 2,327 | ||||||||||
| MH & Annual RV Occupancy %(14) | 98.7 | % | 97.6 | % | 97.0 | % | 96.4 | % | 95.3 | % | |||||
| Transient RV sites | 987 | 962 | 962 | 930 | 574 | ||||||||||
| Sites for development | 1,225 | 1,250 | 1,250 | 1,282 | 1,566 | ||||||||||
| NEW HAMPSHIRE | |||||||||||||||
| Properties | 10 | 10 | 10 | 10 | 10 | ||||||||||
| MH & Annual RV Developed sites(14) | 1,777 | 1,776 | 1,777 | 1,833 | 1,827 | ||||||||||
| Occupied MH & Annual RV(14) | 1,769 | 1,769 | 1,767 | 1,822 | 1,816 | ||||||||||
| MH & Annual RV Occupancy %(14) | 99.5 | % | 99.6 | % | 99.4 | % | 99.4 | % | 99.4 | % | |||||
| Transient RV sites | 602 | 456 | 460 | 404 | 410 | ||||||||||
| Sites for development | 151 | 151 | 151 | 151 | 151 | ||||||||||
| NEW YORK | |||||||||||||||
| Properties | 10 | 10 | 9 | 9 | 9 | ||||||||||
| MH & Annual RV Developed sites(14) | 1,457 | 1,452 | 1,419 | 1,414 | 1,403 | ||||||||||
| Occupied MH & Annual RV(14) | 1,428 | 1,415 | 1,380 | 1,371 | 1,358 | ||||||||||
| MH & Annual RV Occupancy %(14) | 98.0 | % | 97.5 | % | 97.3 | % | 97.0 | % | 96.8 | % | |||||
| Transient RV sites | 1,684 | 1,689 | 1,422 | 900 | 911 | ||||||||||
| Sites for development | 371 | 371 | 371 | 371 | 371 | ||||||||||
| OHIO | |||||||||||||||
| Properties | 9 | 9 | 9 | 9 | 9 | ||||||||||
| MH & Annual RV Developed sites(14) | 2,797 | 2,797 | 2,790 | 2,790 | 2,778 | ||||||||||
| Occupied MH & Annual RV(14) | 2,770 | 2,760 | 2,755 | 2,758 | 2,736 | ||||||||||
| MH & Annual RV Occupancy %(14) | 99.0 | % | 98.7 | % | 98.7 | % | 98.9 | % | 98.5 | % | |||||
| Transient RV sites | 128 | 128 | 135 | 135 | 147 | ||||||||||
| Sites for development | 22 | 22 | 22 | 22 | 22 | ||||||||||
| OTHER STATES | |||||||||||||||
| Properties | 80 | 80 | 77 | 73 | 74 | ||||||||||
| MH & Annual RV Developed sites(14) | 17,422 | 17,310 | 16,896 | 16,484 | 16,578 | ||||||||||
| Occupied MH & Annual RV(14) | 16,934 | 16,796 | 16,394 | 15,977 | 16,046 | ||||||||||
| MH & Annual RV Occupancy %(14) | 97.2 | % | 97.0 | % | 97.0 | % | 96.9 | % | 96.8 | % | |||||
| Transient RV sites | 8,861 | 8,269 | 7,161 | 6,901 | 6,745 | ||||||||||
| Sites for development | 1,925 | 1,969 | 1,969 | 2,044 | 2,294 | ||||||||||
| TOTAL – MH AND RV PORTFOLIO | |||||||||||||||
| Properties | 455 | 452 | 446 | 432 | 426 | ||||||||||
| MH & Annual RV Developed sites(14) | 126,255 | 125,317 | 124,252 | 122,026 | 120,472 | ||||||||||
| Occupied MH & Annual RV(14) | 123,010 | 121,969 | 120,952 | 118,592 | 117,165 | ||||||||||
| MH & Annual RV Occupancy %(14) | 97.4 | % | (15) | 97.3 | % | 97.3 | % | 97.2 | % | 97.3 | % | ||||
| Transient RV sites | 27,032 | 26,295 | 25,043 | 23,728 | 22,360 | ||||||||||
| Sites for development(16) | 9,443 | 9,676 | 10,025 | 10,130 | 9,742 | ||||||||||
| % Communities age restricted | 32.5 | % | 32.7 | % | 33.2 | % | 33.6 | % | 34.0 | % | |||||
| Marina Property Summary(a) | |||||||||
| 6/30/2021 | 03/31/2021 | 12/31/2020 | |||||||
| FLORIDA | |||||||||
| Properties | 18 | 16 | 14 | ||||||
| Total wet slips and dry storage spaces | 4,186 | 3,837 | 3,585 | ||||||
| CONNECTICUT | |||||||||
| Properties | 11 | 11 | 11 | ||||||
| Total wet slips and dry storage spaces | 3,262 | 3,262 | 3,262 | ||||||
| RHODE ISLAND | |||||||||
| Properties | 11 | 11 | 11 | ||||||
| Total wet slips and dry storage spaces | 3,207 | 2,829 | 2,829 | ||||||
| MASSACHUSETTS | |||||||||
| Properties | 9 | 9 | 7 | ||||||
| Total wet slips and dry storage spaces | 2,650 | 2,650 | 2,223 | ||||||
| NEW YORK | |||||||||
| Properties | 8 | 8 | 8 | ||||||
| Total wet slips and dry storage spaces | 2,629 | 2,629 | 2,629 | ||||||
| MARYLAND | |||||||||
| Properties | 8 | 8 | 8 | ||||||
| Total wet slips and dry storage spaces | 2,110 | 2,110 | 2,110 | ||||||
| OTHER STATES | |||||||||
| Properties | 49 | 47 | 47 | ||||||
| Total wet slips and dry storage spaces | 23,231 | 22,693 | 22,693 | ||||||
| TOTAL – MARINA PORTFOLIO | |||||||||
| Properties | 114 | 110 | 106 | ||||||
| Total wet slips and dry storage spaces | 41,275 | 40,010 | 39,331 | ||||||
(a) Total wet slips and dry storage spaces are adjusted each quarter based on site configuration and usability.
Capital Improvements, Development and Acquisitions
(amounts in thousands except for *)
| Recurring Capital Expenditures Average / MH & RV Site* | Recurring Capital Expenditures Average / Marina Site* | Recurring Capital Expenditures – MH / RV(17) | Recurring Capital Expenditures – Marina(17) | Lot Modifications(18) | Acquisitions(19) | Expansion and Development(20) |
Growth Projects(21) | |||||||||||||||||
| YTD 2021 | $ | 178 | $ | 149 | $ | 21,697 | $ | 5,909 | $ | 16,945 | $ | 692,344 | $ | 90,380 | $ | 36,357 | ||||||||
| 2020 | $ | 265 | N/A | $ | 31,398 | $ | 2,074 | $ | 29,789 | $ | 3,105,296 | $ | 248,146 | $ | 28,315 | |||||||||
| 2019 | $ | 345 | N/A | $ | 30,382 | N/A | $ | 31,135 | $ | 930,668 | $ | 281,808 | $ | 9,638 | ||||||||||
Operating Statistics for MH and Annual RVs
| Locations | Resident Move-outs | Net Leased Sites(5) | New Home Sales | Pre-owned Home Sales | Brokered Re-sales |
||||||||||
| Florida | 1,251 | 319 | 116 | 126 | 972 | ||||||||||
| Michigan | 241 | 113 | 29 | 807 | 124 | ||||||||||
| Ontario, Canada | 471 | 121 | 43 | 5 | 221 | ||||||||||
| Texas | 177 | 159 | 44 | 213 | 39 | ||||||||||
| Arizona | 60 | 86 | 15 | 23 | 132 | ||||||||||
| Indiana | 34 | 20 | 5 | 147 | 9 | ||||||||||
| Ohio | 58 | 15 | 1 | 59 | 9 | ||||||||||
| California | 68 | 11 | 14 | 4 | 82 | ||||||||||
| Colorado | 1 | 40 | 34 | 16 | 21 | ||||||||||
| Connecticut | 19 | 18 | 20 | 2 | 25 | ||||||||||
| New York | 87 | 24 | 6 | 1 | 7 | ||||||||||
| New Hampshire | — | 2 | 4 | — | 22 | ||||||||||
| Maine | 73 | 6 | 6 | 6 | 1 | ||||||||||
| Other states | 702 | 163 | 39 | 208 | 110 | ||||||||||
| Six Months Ended June 30, 2021 | 3,242 | 1,097 | 376 | 1,617 | 1,774 | ||||||||||
| Total For Year Ended | Resident Move-outs | Net Leased Sites(5) | New Home Sales | Pre-owned Home Sales | Brokered Re-sales |
||||||||||
| 2020 | 5,365 | 2,505 | 570 | 2,296 | 2,557 | ||||||||||
| 2019 | 4,139 | 2,674 | 571 | 2,868 | 2,231 | ||||||||||
| Percentage Trends | Resident Move-outs | Resident Re-sales |
||||
| 2021 TTM | 2.1 | % | 8.1 | % | ||
| 2020 | 3.3 | % | 6.9 | % | ||
| 2019 | 2.6 | % | 6.6 | % | ||
Footnotes and Definitions
(1) Investors in and analysts following the real estate industry utilize funds from operations (“FFO”), net operating income (“NOI”), and earnings before interest, tax, depreciation and amortization (“EBITDA”) as supplemental performance measures. The Company believes that FFO, NOI, and EBITDA are appropriate measures given their wide use by and relevance to investors and analysts. Additionally, FFO, NOI, and EBITDA are commonly used in various ratios, pricing multiples, yields and returns and valuation calculations used to measure financial position, performance and value.
- FFO, reflecting the assumption that real estate values rise or fall with market conditions, principally adjusts for the effects of generally accepted accounting principles (“GAAP”) depreciation and amortization of real estate assets.
- NOI provides a measure of rental operations that does not factor in depreciation, amortization and non-property specific expenses such as general and administrative expenses.
- EBITDA provides a further measure to evaluate ability to incur and service debt and to fund dividends and other cash needs.
FFO is defined by the National Association of Real Estate Investment Trusts (“NAREIT”) as GAAP net income (loss), excluding gains (or losses) from sales of depreciable operating property, plus real estate related depreciation and amortization, real estate related impairments, and after adjustments for nonconsolidated partnerships and joint ventures. FFO is a non-GAAP financial measure that management believes is a useful supplemental measure of the Company’s operating performance. By excluding gains and losses related to sales of previously depreciated operating real estate assets, impairment and excluding real estate asset depreciation and amortization (which can vary among owners of identical assets in similar condition based on historical cost accounting and useful life estimates), FFO provides a performance measure that, when compared period-over-period, reflects the impact to operations from trends in occupancy rates, rental rates, and operating costs, providing perspective not readily apparent from GAAP net income (loss). Management believes the use of FFO has been beneficial in improving the understanding of operating results of REITs among the investing public and making comparisons of REIT operating results more meaningful. The Company also uses FFO excluding certain gain and loss items that management considers unrelated to the operational and financial performance of our core business (“Core FFO”). The Company believes that Core FFO provides enhanced comparability for investor evaluations of period-over-period results.
The Company believes that GAAP net income (loss) is the most directly comparable measure to FFO. The principal limitation of FFO is that it does not replace GAAP net income (loss) as a performance measure or GAAP cash flow from operations as a liquidity measure. Because FFO excludes significant economic components of GAAP net income (loss) including depreciation and amortization, FFO should be used as a supplement to GAAP net income (loss) and not as an alternative to it. Further, FFO is not intended as a measure of a REIT’s ability to meet debt principal repayments and other cash requirements, nor as a measure of working capital. FFO is calculated in accordance with the Company’s interpretation of standards established by NAREIT, which may not be comparable to FFO reported by other REITs that interpret the NAREIT definition differently.
NOI is derived from revenues minus property operating expenses and real estate taxes. NOI is a non-GAAP financial measure that the Company believes is helpful to investors as a supplemental measure of operating performance because it is an indicator of the return on property investment and provides a method of comparing property performance over time. The Company uses NOI as a key measure when evaluating performance and growth of particular properties and / or groups of properties. The principal limitation of NOI is that it excludes depreciation, amortization, interest expense and non-property specific expenses such as general and administrative expenses, all of which are significant costs. Therefore, NOI is a measure of the operating performance of the properties of the Company rather than of the Company overall.
The Company believes that GAAP net income (loss) is the most directly comparable measure to NOI. NOI should not be considered to be an alternative to GAAP net income (loss) as an indication of the Company’s financial performance or GAAP cash flow from operating activities as a measure of the Company’s liquidity; nor is it indicative of funds available for the Company’s cash needs, including its ability to make cash distributions. Because of the inclusion of items such as interest, depreciation, and amortization, the use of GAAP net income (loss) as a performance measure is limited as these items may not accurately reflect the actual change in market value of a property, in the case of depreciation and in the case of interest, may not necessarily be linked to the operating performance of a real estate asset, as it is often incurred at a parent company level and not at a property level.
EBITDA as defined by NAREIT (referred to as “EBITDAre“) is calculated as GAAP net income (loss), plus interest expense, plus income tax expense, plus depreciation and amortization, plus or minus losses or gains on the disposition of depreciated property (including losses or gains on change of control), plus impairment write-downs of depreciated property and of investments in nonconsolidated affiliates caused by a decrease in value of depreciated property in the affiliate, and adjustments to reflect the entity’s share of EBITDAre of nonconsolidated affiliates. EBITDAre is a non-GAAP financial measure that the Company uses to evaluate its ability to incur and service debt, fund dividends and other cash needs and cover fixed costs. Investors utilize EBITDAre as a supplemental measure to evaluate and compare investment quality and enterprise value of REITs. The Company also uses EBITDAre excluding certain gain and loss items that management considers unrelated to measurement of the Company’s performance on a basis that is independent of capital structure (“Recurring EBITDA”).
The Company believes that GAAP net income (loss) is the most directly comparable measure to EBITDAre. EBITDAre is not intended to be used as a measure of the Company’s cash generated by operations or its dividend-paying capacity, and should therefore not replace GAAP net income (loss) as an indication of the Company’s financial performance or GAAP cash flow from operating, investing and financing activities as measures of liquidity.
(2) Same Community results reflect constant currency for comparative purposes. Canadian currency figures in the prior comparative period have been translated at 2021 average exchange rates.
(3) The MH and RV blended occupancy is derived from 119,933 developed sites, of which 117,536 were occupied. The adjusted MH and RV blended occupancy percentage for 2020 has been adjusted to reflect incremental period-over-period growth from newly rented expansion sites and the conversion of transient RV sites to annual RV sites. The adjusted MH and RV blended occupancy percentage for 2021 is derived from 118,907 developed sites, of which 117,536 were occupied. The number of developed sites excludes RV transient sites and over 1,000 recently completed but vacant MH expansion sites.
(4) The effect of certain anti-dilutive convertible securities is excluded from these items.
(5) Revenue producing site gains do not include occupied sites acquired during that year.
(6) Other expense, net was as follows (in thousands):
| Three Months Ended | Six Months Ended | ||||||||||||||||||
| June 30, 2021 | June 30, 2020 | June 30, 2021 | June 30, 2020 | ||||||||||||||||
| Foreign currency remeasurement income / (loss) | $ | 181 | $ | (195 | ) | $ | 159 | $ | (415 | ) | |||||||||
| Contingent consideration expense | (72 | ) | (84 | ) | (143 | ) | (166 | ) | |||||||||||
| Long term lease termination expense | — | (273 | ) | — | (273 | ) | |||||||||||||
| GTSC repair reserve | (144 | ) | (269 | ) | (525 | ) | (939 | ) | |||||||||||
| Non-cash lease amortization expense | (625 | ) | — | (1,250 | ) | — | |||||||||||||
| Other expenses, net | $ | (660 | ) | $ | (821 | ) | $ | (1,759 | ) | $ | (1,793 | ) | |||||||
(7) Other acquisition related costs represent the expenses incurred to bring recently acquired properties up to the Company’s operating standards, including items such as tree trimming and painting costs that do not meet the Company’s capitalization policy. These costs also include nonrecurring integration expenses associated with a new acquisition.
(8) Line of credit and other debt includes borrowings under the Company’s $2.0 billion New Credit Facility and a $12.0 million MH floor plan facility. The effective interest rate on the MH floor plan facility was 7.0 percent for the quarters ended June 30 and March 31, 2021, and 6.0 percent for the quarters ended December 31, September 30 and June 30, 2020. However, the Company pays no interest if the floor plan balance is repaid within 60 days.
(9) Same Community results net $16.8 million and $14.3 million of certain utility revenue against the related utility expense in property operating and maintenance expense for the three months ended June 30, 2021 and 2020, respectively. Same Community results net $33.2 million and $29.1 million of utility revenue against the related utility expense in property operating and maintenance expense for the six months ended June 30, 2021 and 2020, respectively.
(10) Same Community supplies and repair expense excludes $0.5 million and $0.9 million for the three and six months ended June 30, 2020, respectively, of expenses incurred for recently acquired properties to bring the properties up to the Company’s operating standards, including items such as tree trimming and painting costs that do not meet the Company’s capitalization policy.
(11) Monthly base rent per site pertains to annual RV sites and excludes transient RV sites.
(12) Calculated using actual results without rounding.
(13) MH and RV acquisitions and other is comprised of eight properties acquired and five properties that the Company has an interest in, but does not operate in 2021, 23 properties acquired in 2020, two Florida Keys properties that require redevelopment as a result of damage sustained from Hurricane Irma in 2017, seven recently opened ground-up developments, one property undergoing redevelopment, four properties previously classified as held for sale and other miscellaneous transactions and activity.
(14) Includes MH and annual RV sites, and excludes transient RV sites, as applicable.
(15) As of June 30, 2021, total portfolio MH occupancy was 96.7 percent inclusive of the impact of nearly 1,200 recently constructed but vacant MH expansion sites, and annual RV occupancy was 100.0 percent.
(16) Total sites for development were comprised of approximately 77.9 percent for expansion, 19.8 percent for greenfield development and 2.3 percent for redevelopment.
(17) Property recurring capital expenditures are necessary to maintain asset quality, including purchasing and replacing assets used to operate the communities, resorts and marinas. Recurring capital expenditures at our MH and RV properties include items such as: major road, driveway, pool improvements; clubhouse renovations; adding or replacing street lights; playground equipment; signage; maintenance facilities; manager housing and property vehicles. Recurring capital expenditures at our marinas include items such as: dredging, dock repairs and improvements, and equipment maintenance and upgrades. The minimum capitalized amount is five hundred dollars.
(18) Lot modification capital expenditures are MH expenditures necessary to improve the asset quality of the community. These costs are incurred when an existing older home moves out, and the site is prepared for a new home, more often than not, a multi-sectional home. These activities, which are mandated by strict manufacturer’s installation requirements and state building code, include items such as new foundations, driveways, and utility upgrades.
(19) Capital expenditures related to acquisitions represent the purchase price of existing operating properties (including marinas) and land parcels to develop expansions or new properties. These costs for the six months ended June 30, 2021 include $70.7 million of capital improvements identified during due diligence that are necessary to bring the communities, resorts and marinas to the Company’s operating standards. For the years ended December 31, 2020 and 2019, these costs were $40.6 million and $50.7 million, respectively. These include items such as: upgrading clubhouses; landscaping; new street light systems; new mail delivery systems; pool renovation including larger decks, heaters, and furniture; new maintenance facilities; and new signage including main signs and internal road signs. These are considered acquisition costs and although identified during due diligence, often require 24 to 36 months after closing to complete.
(20) Expansion and development expenditures consist primarily of construction costs and costs necessary to complete home and RV site improvements, such as driveways, sidewalks and landscaping at our MH communities and RV resorts.
(21) Growth projects consist of revenue generating or expense reducing activities at MH communities, RV resorts and marinas. This includes, but is not limited to, utility efficiency and renewable energy projects, site, slip or amenity upgrades such as the addition of a garage, shed or boat lift, and other special capital projects that substantiate an incremental rental increase.
Certain financial information has been revised to reflect reclassifications in prior periods to conform to current period presentation.
Attachment
IV) Additional Information, More MHProNews Analysis and Commentary
It would not be a surprise if David Goch fails to respond. After all, how does someone defend against a growing pile of evidence that makes his letter look like an intimidation document that offers a fig leaf of cover by claiming things that are demonstrably untrue?
There were any number of opportunities during the Obama and Trump years for MHI and its dominating brands to prove that they want growth and the best interests of the industry at large. But time and again, the evidence apparently reflects that MHI is either massively inept, masterful in razzle dazzle paltering, or and/or is engaged in racketeering and antitrust violating efforts to consolidate the industry. That consolidation is obtained precisely by not aggressively engaging in legal or other action that could cause a strong and sustainable surge in new manufactured home sales and production. For some examples during the Trump-years, see the reports linked below.


In hindsight, MHI has had years of opportunities to engage in a manner that could have resulted in serious, ethical and sustainable growth are apparent to detail minded MHProNews readers. As a comment to Goch’s letter, the evidence cries out – pure BS. Debate that, Goch, Gooch, MHI, and your dominating brands.


###
Next up is our business daily recap of yesterday evening’s market report and related left-right headlines.
The Business Daily Manufactured Home Industry Connected Stock Market Updates. Plus, Market Moving Left (CNN) – Right (Newsmax) Headlines Snapshot. While the layout of this business daily report has recently been modified, several elements of the basic concepts used previously are still the same. The headlines that follow below can be reviewed at a glance to save time while providing insights across the left-right media divide. Additionally, those headlines often provide clues as to possible ‘market-moving’ items.
Market Indicator Closing Summaries – Yahoo Finance Closing Tickers on MHProNews…


Headlines from left-of-center CNN Business = evening of 7.26.2021
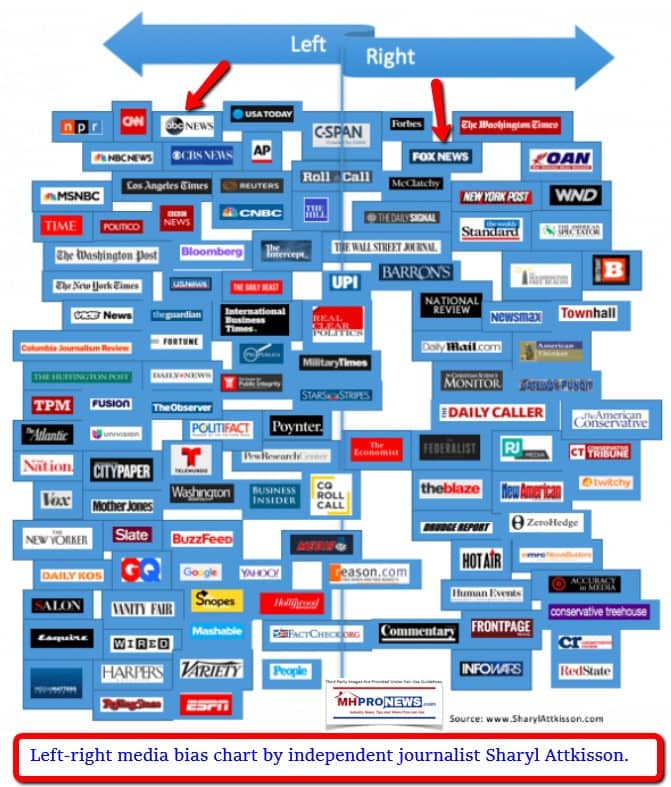
- Blowing past expectations
- Elon Musk, chief executive officer of Tesla Inc., arrives at court during the SolarCity trial in Wilmington, Delaware, U.S., on Tuesday, July 13, 2021.
- Tesla reports a net income of $1.1 billion in the second quarter
- An Amazon job listing hints the company may be entering a new market
- Bitcoin, dogecoin and ethereum are suddenly having another great week
- A surprising tech company could be next to join the Dow
- Philip Morris wants cigarettes banned in the United Kingdom by 2030
- Justice Department opposition kills major insurance merger
- China’s private education firms are the latest targets of Beijing’s crackdown
- China’s escalating crackdown on business is moving stocks all over the world
- ANALYSIS Why would anyone trust Brexit Britain again?
- What it’s like to work in a restaurant right now
- Ratings plunged for the Olympics opening ceremony, but streaming was solid
- Reporters and pollsters say vaccine hesitancy is devolving into vaccine refusal
- Got a job offer? There’s more to negotiate than just your salary
- An employee sets a table at Cyprus Restaurant on the Celebrity Edge cruise ship, the first revenue-earning cruise to depart from the U.S. after a pandemic-induced hiatus, traveling to Costa Maya, Mexico, on Sunday, June 27, 2021.
- Goldman Sachs slashes US economic growth forecast over weaker spending on services
- We asked, you answered: The best financial advice you ever got
- LAW & ORDER
- Crocs on display in a Crocs store in Manhattan, New York in June 2019.
- Crocs sues Walmart and others for allegedly copying its popular shoe
- US sues Amazon for selling dangerous products
- Ex-worker sues Sony over alleged racist abuse
- NYC sues Chipotle, alleging labor law violations
- Washington Post reporter sues paper and former editor
- THE OLYMPICS
- TOKYO, JAPAN – MARCH 13: (L-R) President and CEO of Toyota Motor Corporation, Akio Toyoda speaks to the media during a news conference at the Imperial Hotel on March 13, 2015 in Tokyo, Japan. Toyota Motor Co. signed with IOC to join The Olympic Partner Programme (TOP).
- Toyota will have a subdued role at the Olympics in Japan
- This may be the lowest-rated Olympics ever
- NBC faces huge challenge producing Tokyo Games
- See what life was like in the Olympic Village in 1984
- Tokyo Olympics’ economic losses will be ‘enormous’
Headlines from right-of-center Newsmax – evening of 7.26.2021
- Kennedy: Wall Halt Is a ‘Crime Against Nature and Intelligence’
- In a photo taken on March 28, ranch owner Tony Sandoval stands before a portion of the unfinished border wall that former US president Donald Trump tried to build, near the southern Texas border city of Roma.
- According to a minority staff report from a Senate panel subcommittee, the Biden administration is paying contractors at least $3 million a day to guard steel, concrete, and other materials in the desert — and wasting up to $2 billion by canceling two border wall contracts in south Texas. “I don’t think the Biden administration has ever told the truth about the border,” Kennedy has said. [Full Story]
- Related Stories
- Biden Admin Cancels 2 Border Wall Contracts in South Texas
- Texas Governor’s Border Wall Construction Starts Along Rio Grande
- Newsmax TV
- ‘QAnon Shaman’ Attorney: Client Suffering Mental Issues Behind Bars
- Gaetz: McCarthy Must Pull Kinzinger, Cheney From Committees |
- Hoffman: Trump ‘on Point’ With Border Comments |
- Norman: Americans Will ‘Revolt’ If Mask Mandate Returns |
- ZOA’s Klein: Ben & Jerry’s Committing ‘Economic Terrorism’ |
- Mark Meadows: Infrastructure Biased for Dem Run Cities |
- More Newsmax TV
- Newsfront
- VA Is 1st Major US Agency to Require Vaccine for Health Care Workers
- The Department of Veterans Affairs on Monday became the first major federal agency to require health care workers to get COVID-19 vaccines, as the aggressive delta variant spreads and some communities report troubling increases in hospitalizations among unvaccinated…… [Full Story]
- Related Stories
- California, NYC to Require Employees to Get COVID-19 Vaccine
- Cuomo Casts Doubt on Trustworthiness of AG’s Investigators
- New York Gov. Andrew Cuomo has questioned the credibility of the [Full Story]
- Astronomers Seek Evidence of Tech Built by Aliens
- An international team of scientists led by a prominent Harvard [Full Story]
- Rudy Giuliani Exposes Biden and The Fed’s Talks of the ‘Great Reset’
- Stocks edged higher on Wall Street in muted trading Monday, placing [Full Story]
- Embattled Cuomo Questions Neutrality of AG Investigators
- Embattled Cuomo Questions Neutrality of AG Investigators
- Andrew Cuomo projected confidence Monday that he’ll ultimately [Full Story]
- Biden’s Hyper-Inflation, It’s Here!
- Newsmax Magazine special report reveals surprising facts … [Full Story]
- Russia Announces Work on New ‘Doomsday Plane’
- Russian state media on Monday announced that the country is currently [Full Story]
- The ‘Woke’ Olympics’ Athletes to Watch
- Forget gymnastics, swimming, track, and baseball – the premiere [Full Story] |
- Rasmussen Poll: View of Media’s COVID Coverage Sours Since Trump
- Public approval ratings of COVID-19 media coverage are declining as [Full Story]
- Biden Announces End of US Combat Mission in Iraq
- President Joe Biden and Iraqi Prime Minister Mustafa al-Kadhimi on [Full Story]
- Marjorie Taylor Greene Compares Ban on Unvaccinated to ‘Segregation’
- Marjorie Taylor Greene is comparing an Atlanta restaurant’s [Full Story]
- Family: Last Victim ID’d in Florida Condo Building Collapse
- The final victim of the condo building collapse in Florida has been [Full Story]
- Nicolas Cage’s Private Island Cost Him $7m, and This is What It Looks Like
- Definition
- Report: Facebook Teaming With Religious Groups
- Facebook has been courting religious groups for a partnership, The [Full Story]
- Bezos Offers NASA $2 Billion in Exchange for Moon Mission Contract
- Fresh off his trip to space, billionaire businessman Jeff Bezos on [Full Story]
- Trump Ally Barrack Pleads Not Guilty in UAE Lobbying Case
- Former President Donald Trump’s billionaire ally Thomas Barrack [Full Story]
- New Home Sales Hit 14-Month Low Amid Supply Constraints
- Sales of new U.S. single-family homes tumbled to a 14-month low in [Full Story]
- Kennedy: Border Wall Building Halt ‘Crime Against Nature and Intelligence’
- John Kennedy, R-La., on Monday called the estimated $2 billion [Full Story]
- Morgan Wallen Checked Into Rehab Amid Racial Slur Scandal
- Morgan Wallen has revealed that he checked himself into a rehab [Full Story]
- Russian Authorities Block Dozens of Navalny-Linked Websites
- Russian authorities have restricted access to the website of [Full Story]
- Former Sen. Mike Enzi Hospitalized After Serious Bike Accident
- Former Sen. Mike Enzi remains hospitalized after suffering a serious [Full Story]
- California to Require Proof of Vaccination for State Workers
- California will require state employees and all health care workers [Full Story]
- Tech Companies Unveil Battle Plans Against Extremist, Hate Groups
- Technology companies are taking on hate groups. In one drive, [Full Story]
- ‘QAnon Shaman’ Attorney to Newsmax: Client Suffering Mental Issues Behind Bars
- Albert Watkins, the attorney representing Jan. 6 defendant Jacob [Full Story] |
- Pope to UN Forum: Hunger Is ‘Crime’ Violating Basic Rights
- Pope Francis on Monday decried as criminal the existence of hunger in [Full Story]
- Rand Paul Officially Sends Criminal Referral on Fauci to DOJ
- Rand Paul, R-Ky., has requested that Attorney General Merrick [Full Story]
- Biden: Uncertain if Dreamers Will Be Legalized in Bill
- President Joe Biden said “it remains to be seen” if a pathway to [Full Story]
- Biden Admin Cancels 2 Border Wall Contracts in Texas
- The Biden administration has canceled two border wall contracts along [Full Story]
- With Virus Surge, US to Keep Travel Restrictions for Now
- The United States will keep existing COVID-19 travel restrictions on [Full Story]
- Poll: Americans Divided Over Trans Athletes at Olympics
- Americans remain starkly divided over how transgender athletes ought [Full Story]
- NY Police Officers Heroes After Saving Baby Pinned Under Car
- Two New York police officers are being hailed as heroes after they [Full Story]
- Incredible Miniature Telescope Lets You See for Miles
- Starscope
- More Newsfront
- Finance
- Philip Morris to Stop Selling Cigarettes in UK Within 10 Years
- Philip Morris International’s chief executive told the Daily Mail on Sunday his company will stop selling cigarettes in Great Britain within the next decade. Jacek Olczak, who became the company’s CEO in May… [Full Story]
- Amazon Job Posting Hints at Plan to Accept Cryptocurrency
- Oil Resumes Decline With Demand Outlook Clouded by Delta Spread
- Wall Street Firm Tells Staff to Take the Week Off
- As Virus Jumps and Supply Chains Falter, Fed Faces Twin Inflation, Growth Risks
- More Finance
- Health
- Should Vaccinated People Mask up With COVID-19 Cases Rising?
- It depends on your situation, but masking in public can provide another layer of protection and help prevent the virus from spreading to others who aren’t protected. An easing of safety precautions and the large number of people who remain unvaccinated in many regions are… [Full Story]
- VA Is 1st Major US Agency to Require Vaccination for Health Care Workers
- Cleaning Up the Air Could Help Prevent Alzheimer’s
- Severe Sleep Apnea Linked to Blood Vessel Damage
- Daylight Saving Time Change Toughest on Night Owls


Manufactured Housing Industry Investments Connected Equities Closing Tickers
Some of these firms invest in manufactured housing, or are otherwise connected, but may do other forms of investing or business activities too.
-
-
-
-
-
-
-
-
-
-
-
-
- NOTE: The chart below includes the Canadian stock, ECN, which purchased Triad Financial Services, a manufactured home industry lender
- NOTE: Drew changed its name and trading symbol at the end of 2016 to Lippert (LCII).
- NOTE: Deer Valley was largely taken private, say company insiders in a message to MHProNews on 12.15.2020, but there are still some outstanding shares of the stock from the days when it was a publicly traded firm. Thus, there is still periodic activity on DVLY.
-
-
-
-
-
-
-
-
-
-
-


Spring 2021…
Berkshire Hathaway is the parent company to Clayton Homes, 21st Mortgage, Vanderbilt Mortgage and other factory built housing industry suppliers.
· LCI Industries, Patrick, UFPI, and LP each are suppliers to the manufactured housing industry, among others.
· AMG, CG, and TAVFX have investments in manufactured housing related businesses. For insights from third-parties and clients about our publisher, click here.
Enjoy these ‘blast from the past’ comments.
MHProNews. MHProNews – previously a.k.a. MHMSM.com – has celebrated our 11th year of publishing, and is starting our 12the year of serving the industry as the runaway most-read trade media.

Sample Kudos over the years…
It is now 11+ years and counting…
Learn more about our evolutionary journey as the industry’s leading trade media, at the report linked below.
· For expert manufactured housing business development or other professional services, click here.
· To sign up in seconds for our industry leading emailed headline news updates, click here.
Disclosure. MHProNews holds no positions in the stocks in this report.


That’s a wrap on this installment of “News Through the Lens of Manufactured Homes and Factory-Built Housing” © where “We Provide, You Decide.” © (Affordable housing, manufactured homes, stock, investing, data, metrics, reports, fact-checks, analysis, and commentary. Third-party images or content are provided under fair use guidelines for media.) (See Related Reports, further below. Text/image boxes often are hot-linked to other reports that can be access by clicking on them.)

By L.A. “Tony” Kovach – for MHProNews.
Tony earned a journalism scholarship along with numerous awards in history. There have been several awards and honors and olso recognition in manufactured housing. For example, he earned the prestigious Lottinville Award in history from the University of Oklahoma, where he studied history and business management. He’s a managing member and co-founder of LifeStyle Factory Homes, LLC, the parent company to MHProNews, and MHLivingNews.com. This article reflects the LLC’s and/or the writer’s position, and may or may not reflect the views of sponsors or supporters.