

By far the largest state in the United States in terms of manufactured home production and shipments is Texas. The first graphic below makes that factual point. While Texas doesn’t always reflect the same trends as national data does, it often does.
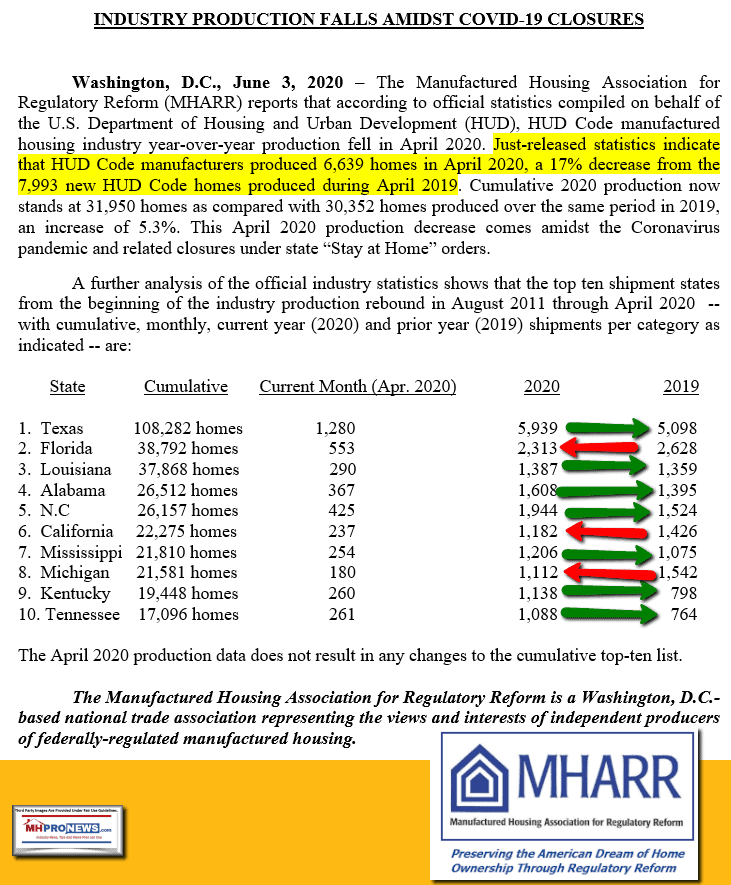
The Texas data should be considered in the light of last month’s national data based on data collected for HUD as reported by the Manufactured Housing Association for Regulatory Reform (MHARR) reported below.
The Texas Manufactured Housing Association (TMHA) has produced the following report on Wednesday, July 1, 2020 8:35 AM. National data is pending and will be provided to MHProNews readers after it becomes available. It will be followed by an MHProNews Analysis and Commentary. Note that the TMHA graphics may not be in the same sequence as it appeared in their report.

MAY
May manufactured housing shipments moved up slightly over April and the gains were better than the raw totals suggest. With the Memorial holiday and the month starting on a Friday, May had two less production days than April and two less than May of 2019.

The rate of homes shipped per day moved up to 57 homes after bottoming at 52 last month. Part of the run rate increase was due to an expansion in single-section homes shipped and the larger share of the total they represented. The raw total of multi-section shipments moved down from last month.
If we add two additional days of May’s run rate to the total homes shipped and then compare that to last month, May would have been up 10.7%, and the year-over-year decline from May of 2019 would have been -13.5% rather than the -21.3% we see in the raw totals. The short month is pulling the comparisons down and masking some of the improvement from last month.
Looking forward to June, we’re forecasting 1,233 shipments for this past month.

Seasonal trends tend to pull shipments down starting in June, but this year the month will have two additional production days over May and we’re hearing from several member manufacturers that their run rates were picking up, so take the over against the model.
In other positive news, the MHBI finished the month up over May, and from the demand side, the new homes titled per day rate moved up to 75, its highest total since it registered 78 in January to start the year. The title rate was above June of 2019’s 73 homes a day.

I’ve built out a new interactive chart below that gives a better since of where shipments are currently landing compared to past years.
COVID-19 cases have picked up in Texas over the past few weeks, so there is still a lot of uncertainty out there about where our economy is headed.
I hope you all stay safe, stay healthy, and have a great Fourth of July weekend!
##

The video below is a TMHA flashback video featuring their executive director, D.J. Pendleton, J.D.
June 2020 Jobs Report – Per U.S. Department of Labor Media Release to MHProNews and others.
THE EMPLOYMENT SITUATION — JUNE 2020
Total nonfarm payroll employment rose by 4.8 million in June, and the unemployment rate
declined to 11.1 percent, the U.S. Bureau of Labor Statistics reported today. These
improvements in the labor market reflected the continued resumption of economic activity
that had been curtailed in March and April due to the coronavirus (COVID-19) pandemic
and efforts to contain it. In June, employment in leisure and hospitality rose sharply.
Notable job gains also occurred in retail trade, education and health services, other
services, manufacturing, and professional and business services.
This news release presents statistics from two monthly surveys. The household survey
measures labor force status, including unemployment, by demographic characteristics.
The establishment survey measures nonfarm employment, hours, and earnings by industry.
For more information about the concepts and statistical methodology used in these two
surveys, see the Technical Note.
Household Survey Data
The unemployment rate declined by 2.2 percentage points to 11.1 percent in June, and
the number of unemployed persons fell by 3.2 million to 17.8 million. Although
unemployment fell in May and June, the jobless rate and the number of unemployed are up
by 7.6 percentage points and 12.0 million, respectively, since February. (See table A-1.
For more information about how the household survey and its measures were affected by
the coronavirus pandemic, see the box note at the end of the news release.)
Among the major worker groups, the unemployment rates declined in June for adult men
(10.2 percent), adult women (11.2 percent), teenagers (23.2 percent), Whites (10.1
percent), Blacks (15.4 percent), and Hispanics (14.5 percent). The jobless rate for
Asians (13.8 percent) changed little over the month. (See tables A-1, A-2, and A-3.)
The number of unemployed persons who were on temporary layoff decreased by 4.8 million
in June to 10.6 million, following a decline of 2.7 million in May. The number of
permanent job losers continued to rise, increasing by 588,000 to 2.9 million in June.
The number of unemployed reentrants to the labor force rose by 711,000 to 2.4 million.
(Reentrants are persons who previously worked but were not in the labor force prior to
beginning their job search.) (See table A-11.)
The number of unemployed persons who were jobless less than 5 weeks declined by 1.0
million to 2.8 million in June. Unemployed persons who were jobless 5 to 14 weeks
numbered 11.5 million, down by 3.3 million over the month, and accounted for 65.2
percent of the unemployed. By contrast, the number of persons jobless 15 to 26 weeks
and the long-term unemployed (those jobless for 27 weeks or more) saw over-the-month
increases (+825,000 to 1.9 million and +227,000 to 1.4 million, respectively). (See
table A-12.)
The labor force participation rate increased by 0.7 percentage point in June to 61.5
percent, but is 1.9 percentage points below its February level. Total employment, as
measured by the household survey, rose by 4.9 million to 142.2 million in June. The
employment-population ratio, at 54.6 percent, rose by 1.8 percentage points over the
month but is 6.5 percentage points lower than in February. (See table A-1.)
In June, the number of persons who usually work full time increased by 2.4 million to
118.9 million, and the number who usually work part time also rose by 2.4 million to
23.2 million. (See table A-9.)
The number of persons employed part time for economic reasons declined by 1.6 million
to 9.1 million in June but is still more than double its February level. These
individuals, who would have preferred full-time employment, were working part time
because their hours had been reduced or they were unable to find full-time jobs. This
group includes persons who usually work full time and persons who usually work part
time. (See table A-8.)
The number of persons not in the labor force who currently want a job, at 8.2 million,
declined by 767,000 in June but remained 3.2 million higher than in February. These
individuals were not counted as unemployed because they were not actively looking for
work during the last 4 weeks or were unavailable to take a job. (See table A-1.)
Persons marginally attached to the labor force–a subset of persons not in the labor
force who currently want a job–numbered 2.5 million in June, little different from the
prior month. These individuals were not in the labor force, wanted and were available
for work, and had looked for a job sometime in the prior 12 months but had not looked
for work in the 4 weeks preceding the survey. Discouraged workers, a subset of the
marginally attached who believed that no jobs were available for them, numbered 681,000
in June, essentially unchanged from the previous month. (See Summary table A.)
Establishment Survey Data
Total nonfarm payroll employment increased by 4.8 million in June, following an increase
of 2.7 million in May. These gains reflect a partial resumption of economic activity
that had been curtailed due to the coronavirus pandemic in April and March, when
employment fell by a total of 22.2 million in the 2 months combined. In June, nonfarm
employment was 14.7 million, or 9.6 percent, lower than its February level. Employment
in leisure and hospitality rose sharply in June. Notable job gains also occurred in
retail trade, education and health services, other services, manufacturing, and
professional and business services. Employment continued to decline in mining. (See
table B-1. For more information about how the establishment survey and its measures
were affected by the coronavirus pandemic, see the box note at the end of the news
release.)
In June, employment in leisure and hospitality increased by 2.1 million, accounting
for about two-fifths of the gain in total nonfarm employment. Over the month,
employment in food services and drinking places rose by 1.5 million, following a gain
of the same magnitude in May. Despite these gains, employment in food services and
drinking places is down by 3.1 million since February. Employment also rose in June
in amusements, gambling, and recreation (+353,000) and in the accommodation industry
(+239,000).
In June, employment in retail trade rose by 740,000, after a gain of 372,000 in May
and losses totaling 2.4 million in March and April combined. On net, employment in the
industry is 1.3 million lower than in February. In June, notable job gains occurred in
clothing and clothing accessories stores (+202,000), general merchandise stores
(+108,000), furniture and home furnishings stores (+84,000), and motor vehicle and
parts dealers (+84,000).
Employment increased by 568,000 in education and health services in June but is 1.8
million below February’s level. Health care employment increased by 358,000 over the
month, with gains in offices of dentists (+190,000), offices of physicians (+80,000),
and offices of other health practitioners (+48,000). Elsewhere in health care, job
losses continued in nursing care facilities (-18,000). Employment increased in the
social assistance industry (+117,000), reflecting gains in child day care services
(+80,000) and in individual and family services (+28,000). Employment in private
education rose by 93,000 over the month.
Employment increased in the other services industry in June (+357,000), with about
three-fourths of the increase occurring in personal and laundry services (+264,000).
Since February, employment in the other services industry is down by 752,000.
In June, manufacturing employment rose by 356,000 but is down by 757,000 since
February. June employment increases were concentrated in the durable goods component,
with motor vehicles and parts (+196,000) accounting for over half of the job gain in
manufacturing. Employment also increased over the month in miscellaneous durable
goods manufacturing (+26,000) and machinery (+18,000). Within the nondurable goods
component, the largest job gain occurred in plastics and rubber products (+22,000).
Professional and business services added 306,000 jobs in June, but employment is 1.8
million below its February level. In June, employment rose in temporary help services
(+149,000), services to buildings and dwellings (+53,000), and accounting and
bookkeeping services (+18,000). By contrast, employment declined in computer systems
design and related services (-20,000).
Construction employment increased by 158,000 in June, following a gain of 453,000 in
May. These gains accounted for more than half of the decline in March and April
(-1.1 million combined). Over-the-month gains occurred in specialty trade contractors
(+135,000), with growth about equally split between the residential and nonresidential
components. Job gains also occurred in construction of buildings (+32,000).
Transportation and warehousing added 99,000 jobs in June, following declines in the
prior 2 months (-588,000 in April and May combined). In June, employment rose in
warehousing and storage (+61,000), couriers and messengers (+21,000), truck
transportation (+8,000), and support activities for transportation (+7,000).
Wholesale trade employment rose by 68,000 in June but is down by 317,000 since
February. In June, job gains occurred in the durable goods (+39,000) and nondurable
goods (+27,000) components.
Financial activities added 32,000 jobs in June, with over half of the gain in real
estate (+18,000). Since February, employment in financial activities is down by
237,000.
Government employment changed little in June (+33,000), as job gains in local
government education (+70,000) were partially offset by job losses in state government
(-25,000). Government employment is 1.5 million below its February level.
Mining continued to lose jobs in June (-10,000), with most of the decline occurring in
support activities for mining (-7,000). Mining employment is down by 123,000 since a
recent peak in January 2019, although nearly three-fourths of the decline has occurred
since February 2020.
In June, average hourly earnings for all employees on private nonfarm payrolls fell by
35 cents to $29.37. Average hourly earnings of private-sector production and
nonsupervisory employees decreased by 23 cents to $24.74 in June. The decreases in
average hourly earnings largely reflect job gains among lower-paid workers; these
changes put downward pressure on the average hourly earnings estimates. (See tables
B-3 and B-8.)
The average workweek for all employees on private nonfarm payrolls decreased by 0.2
hour to 34.5 hours in June. In manufacturing, the workweek rose by 0.5 hour to 39.2
hours, and overtime was unchanged at 2.4 hours. The average workweek for production
and nonsupervisory employees on private nonfarm payrolls fell by 0.2 hour to 33.9
hours. The recent employment changes, especially in industries with shorter workweeks,
complicate monthly comparisons of the average weekly hours estimates. (See tables B-2
and B-7.)
The change in total nonfarm payroll employment for April was revised down by 100,000,
from -20.7 million to -20.8 million, and the change for May was revised up by 190,000,
from +2.5 million to +2.7 million. With these revisions, employment in April and May
combined was 90,000 higher than previously reported. (Monthly revisions result from
additional reports received from businesses and government agencies since the last
published estimates and from the recalculation of seasonal factors.)
_____________
The Employment Situation for July is scheduled to be released on Friday, August 7, 2020, at 8:30 a.m. (ET). Note the still at the top is from this video report earlier this morning from CNBC.
MHProNews Analysis and Commentary
The sharp jump up on the jobs report is one more piece of good economic news in the wake of the weeks of troubling economic shutdowns that have occurred in the U.S. and much of the world.
The data supplied by the TMHA suggests that the shipments there are recovering from pre-COVID19 economic shutdowns.
That should be compared to the data supplied on mainstream housing which in several respects is doing better, despite the price advantage that manufactured housing enjoys.
AEI and other mainstream housing data reflect the point that there is a large, pent up demand for all housing, but affordable housing in particular.
A look at years of prior shipments makes it clear that manufactured housing is only operating at about 25 percent of the level it was in 1998.


That leaves one with the inescapable conclusion that manufactured housing is underperforming by historic and current needs measurements. Given that the RV industry has proven its resilience and ability to grow – and theirs is often a discretionary purchase – that begs the question. Why is manufactured housing underperforming so badly?
See the report linked below for part of that true tale.

To further understand that one must see the reports linked below the byline, offers and notices.
Programming Notice: the new MHProNews email format is now operational, as previously announced and planned. If you haven’t already done so, check your email or sign up in seconds via the link below. No one else in MHVille trade publishing has a larger or more engaged audience, as the publicly undisputed data and fact-checks linked here and here reflect. As an upcoming report will document, our top article in the month of June had an astonishing 1.1 million plus hits; that in an industry of an estimated 75,000 per MHI claims. Beyond industry professionals, federal as well as other public officials, non-profits, investors or others seeking answers and insights on turn to MHProNews daily by the thousands. Our sincere thanks to readers, sponsors and supporters for your confidence.
Thanks too for those who provide tips and information. Those insider insights are part of what makes this the most-trusted and read resource of its kind in manufactured housing.


The most-read story in all of manufactured housing for 2020 is among the reports below the byline and notices, in the related and recent reports.
That’s a wrap on this installment of manufactured housing “Industry News, Tips, and Views Pros Can Use” © where “We Provide, You Decide.” © ## (Affordable housing, manufactured homes, reports, fact-checks, analysis, and commentary. Third-party images or content are provided under fair use guidelines for media.) (See Related Reports, further below. Text/image boxes often are hot-linked to other reports that can be access by clicking on them.)

By L.A. “Tony” Kovach – for MHLivingNews.com.
Tony earned a journalism scholarship and earned numerous awards in history and in manufactured housing. For example, he earned the prestigious Lottinville Award in history from the University of Oklahoma, where he studied history and business management. He’s a managing member and co-founder of LifeStyle Factory Homes, LLC, the parent company to MHProNews, and MHLivingNews.com. This article reflects the LLC’s and/or the writer’s position, and may or may not reflect the views of sponsors or supporters.
Connect on LinkedIn: http://www.linkedin.com/in/latonykovach
Recent and Related Reports:
The text/image boxes below are linked to other reports, which can be accessed by clicking on them.
Warren Buffett Declared “Class Warfare,” Buffett Says Fellow Billionaires – “We’re Winning”
The Runaway Top Read Story in 2020 in
Manufactured Housing Trade Media Is Linked Below.


