Comparing U.S. Cost of Living in 1950s to 2026. Snapshots of Income-Housing-Costs in 1950s vs. 2026. Baseline References for Conventional Housing-Mobile Homes-Manufactured Homes. MHVille FEA
“During the 1950s, the typical cost of a new house was approximately $10,000, a new car cost about $1,750, and the median annual family income was $4,000. The average family size was 3.6 people, while roughly 33% of women participated in the workforce. Monthly housing costs averaged $60, and basic groceries like bread and milk cost $0.14 and $0.82, respectively,” per left-leaning Google’s artificial intelligence (AI) powered overview. More costs and data from that era will follow in Part I. MHProNews notes that some of these factors are not ‘apples to apples’ as the features in housing, automobiles, and TVs – as examples – have clearly shifted from that time until now. In 2026, an average new house is about $445,000, the average price for a new vehicle is about $50,000, and median household income is about $89,000. Labor force participation of women in the workforce has risen to 57.5 percent and women are about 47 percent of the total workforce. More data points from 2026 in Part II. Some “mobile home” era pricing from 1950s and 1970s are shown in Part III.
1) To shed more light on family size, “During the peak of the post-WWII baby boom around 1950, the average American woman had approximately 3.5 children. This period, spanning from the late 1940s to early 1960s, saw a high fertility rate, with families commonly having five or more children. Additionally, in 1950, 52% of family households had children under 18 present.”
Part I. The PDF and screen captures documenting the accuracy of Google’s AIO response is shown at this link here.
During the 1950s, the typical cost of a new house was approximately $10,000, a new car cost about $1,750, and the median annual family income was $4,000. The average family size was 3.6 people, while roughly 33% of women participated in the workforce. Monthly housing costs averaged $60, and basic groceries like bread and milk cost $0.14 and $0.82, respectively.
Housing and Income Statistics
New House: Prices rose from roughly $7,350 in 1950 to $12,700 by 1959.
Annual Income: The median family income grew from $3,300 to $5,400 over the decade.
Housing Costs: Monthly mortgage or rental payments typically ranged between $40 and $75.
Family Size: Reflecting the “Baby Boom,” the average household size was between 3.5 and 3.7 people.
Consumer Goods and Workforce
New Car: A standard new vehicle averaged between $1,500 and $2,200.
Women in Workforce: Female participation in the labor force increased from 29% in 1950 to 35% by 1959.
Common Grocery Items:
Loaf of Bread: $0.14
Gallon of Milk: $0.82
Dozen Eggs: $0.60
Gallon of Gas: $0.27
Part II.
The PDF and screen captures documenting the accuracy of Google’s AIO response is shown at this link here.
In 2026, the American economic landscape is defined by a “new baseline” of higher prices, though some relief is emerging as income growth begins to outpace inflation in several sectors.
WardsAuto +2
Living Costs and Housing
New House Cost: The median sales price for a new home is predicted to be approximately $445,000. Existing home prices are also expected to rise modestly by 2.2% to 3.4%, reaching a median of $425,000 to $450,000.
Mortgage & Rental Costs:
Mortgage: Typical 30-year fixed mortgage rates are expected to average 6.3%. The typical monthly payment is projected to consume 29.3% of median income, falling below the 30% affordability threshold for the first time since 2022.
Rent: The median national rent is projected at $2,110, with single-family homes higher at $2,370. Some forecasts predict a slight 1% annual decline in asking rents due to increased multi-family housing supply.
U.S. News Real Estate +4
Transportation and Income
New Car Cost: The average transaction price for a new vehicle has stabilized at a record high of approximately $50,000. Average monthly car payments for new vehicles are roughly $772.
Typical Family Income: The national median household income is estimated to be between $89,000 and $90,000. To be considered “financially comfortable,” many consultants suggest a minimum family salary of $80,000 to $90,000.
Women in Workforce: The labor force participation rate for women is approximately 57.5%. Women currently represent nearly half (47%) of the total U.S. labor force.
Typical Family Size: The average household size remains around 2.5 to 3.2 people, with Hispanic households averaging the largest at 3.22.
USA Today +9
Grocery Item Costs
Overall grocery (food-at-home) prices are expected to rise by a moderate 1.7% in 2026, which is below the 20-year average.
fmi.org +1
Eggs and Dairy: Expected to see deflation, with egg prices potentially dropping by 22.2% and dairy by 0.9%.
Red Meats: Beef and veal prices are projected to soar by 9.4% due to droughts and shrinking herds.
Sweets and Beverages: Sugars and sweets are predicted to increase by 6.7%, while non-alcoholic beverages (coffee, soda, juice) may rise by 4.2%.
Fresh Produce: Fresh vegetables are expected to rise by 2.0%, while fresh fruits may see a minimal increase of 0.2%.
The PDF and screen captures documenting the accuracy of Google’s AIO response is shown at this link here.
In 1950, a typical mobile home (often called a trailer) was significantly smaller than today’s, often selling for roughly $2,000–$4,000. By 1970, a 12’x60′ (approx. 2-bedroom/1-bath) mobile home generally cost between $6,000 and $8,500. Prices for mobile homes in 1950 were often comparable to a new car, while in 1970, they offered affordable, rapid housing solutions as sizes increased.
Facebook +2
1950s: Small,, often 8-foot wide “tin cans” were common. A used or new unit could often be found for around $1,300 to $3,000, as shown in this Facebook post.
1970s: The industry shifted to 12-foot wide models. Data indicates the average 12’x60′ mobile home sold for about $6,050 in 1970, with new 12’x60′ units ranging from $6,500 to $8,500, according to a Department of Archaeology and Historic Preservation document.
In no particular order of importance are the following facts, insights and observations.
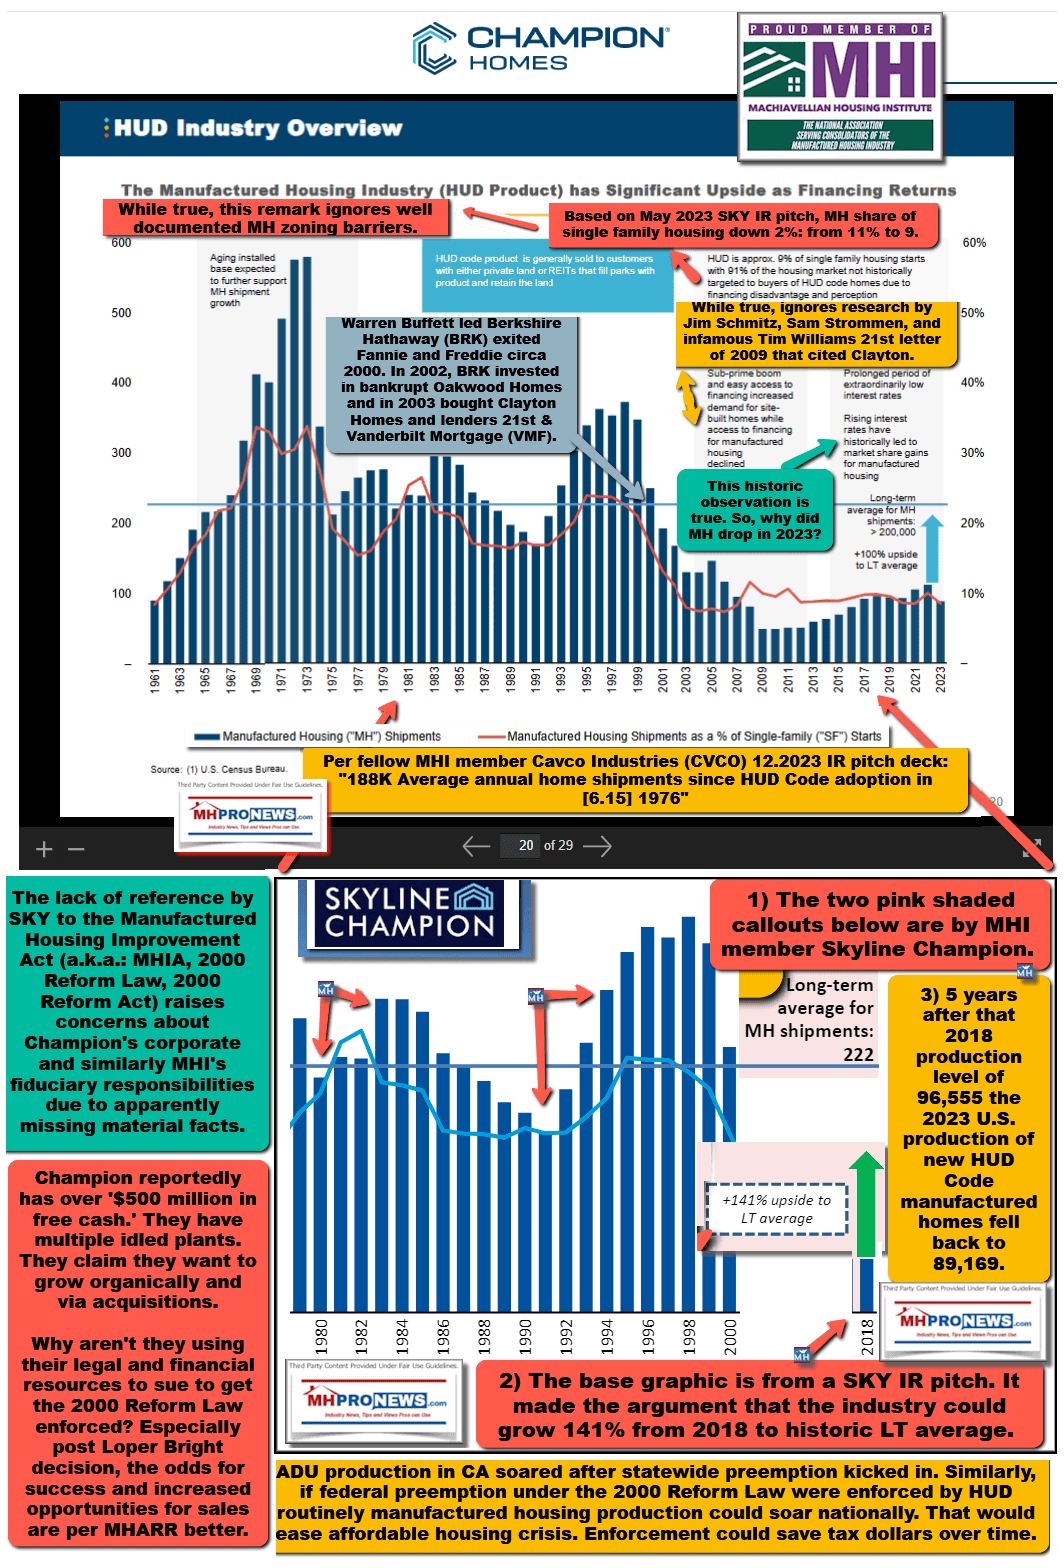
1) Residential (conventional single family and multifamily construction) and mobile to manufactured home (starting June 15, 1976) production by year charts.
As planned report will show, MHProNews appears to have roughly tripled its traffic (visitors) in 12.2025 than in 12.2024. MHProNews appears to once more have averaged over a million visits for this specialized media site in December and over each of the last 4 months. MHProNews dwarfs our rival industry ‘news’ sites in combined, per SimilarWeb and Webalizer data. Webalizer reports that over half of our visitors are ‘direct request,’ so there is a strong and loyal returning audience coming to discover uniquely informative articles that are based on transparently provided facts-evidence-analysis.
Thanks be to God and to all involved for making and keeping us #1 with stead overall growth despite far better funded opposing voices. Transparently provided Facts-Evidence-Analysis (FEA) matters. ##
Our son has grown quite a bit since this 12.2019 photo. All on Capitol Hill were welcoming and interested in our manufactured housing industry related concerns. But Congressman Al Green’s office was tremendous in their hospitality. Our son’s hand is on a package that included the Constitution of the United States, bottled water, and other goodies.
Tony earned a journalism scholarship and earned numerous awards in history and in manufactured housing.
For example, he earned the prestigious Lottinville Award in history from the University of Oklahoma, where he studied history and business management. He’s a managing member and co-founder of LifeStyle Factory Homes, LLC, the parent company to MHProNews, and MHLivingNews.com.
This article reflects the LLC’s and/or the writer’s position and may or may not reflect the views of sponsors or supporters.


 fmi.org +1