

While the pundits break down who has the clearest path to 270, Realtor.com recently took a look at the electoral map in another way. How people in blue, red and swing – also known as “purple” – states live in terms of housing. Data was pulled from Nielsen Demographics, Nielsen Scarborough, Nielsen Financial and Realtor’s own findings.
The report examined who lives in the biggest homes, the most expensive homes, who pays the most rent and more.
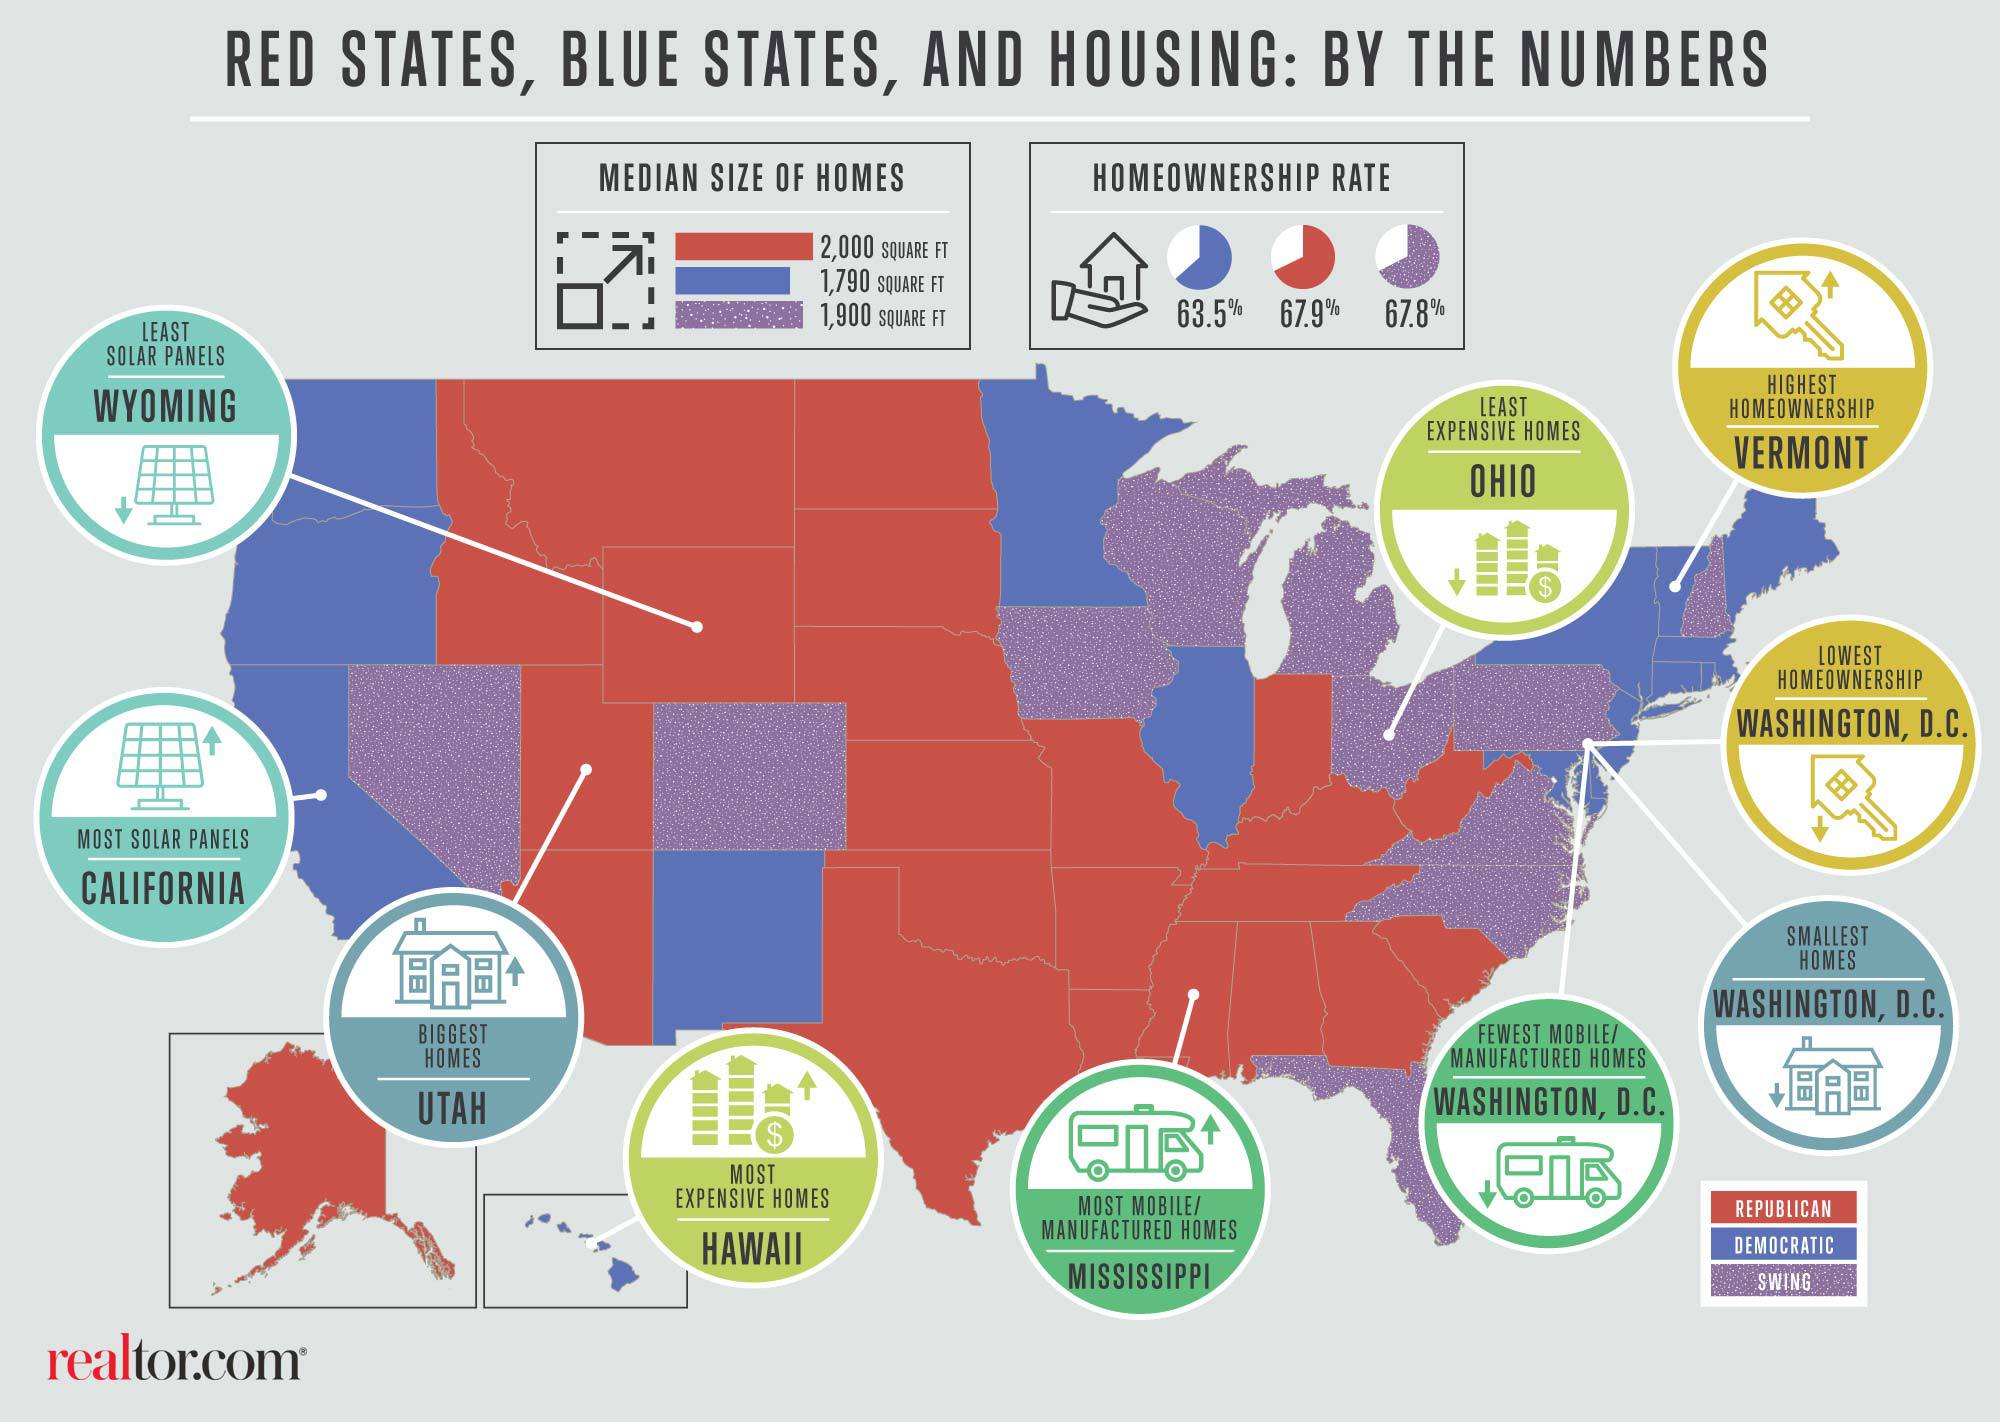
Regarding the manufactured housing industry, Realtor’s research found that people who live in traditionally conservative “red” states are 33 percent more likely to live in “mobile homes” (sic), often found in “trailer parks” (sic) and are more likely to end up living in manufactured homes in those states too.
Red States and MH
Out of all of the traditional red states, the highest concentration of manufactured homes was found in Mississippi; Jackson in particular. Although Realtor’s article referenced Mississippi as an economically “poor state,” note that a lack of finances and living in a manufactured home don’t always go hand-in-hand.

Blue States and MH
Washington, D.C. and traditional blue state New Jersey had the fewest manufactured homes. San Francisco, which has a high cost of living, is the city with the lowest percentage of manufactured homes.
In the swing state of Florida, Miami was the city with the lowest rate of homeownership.
Home Ownership Rates by Red vs. Blue states
The fact that there’s a 33 percent higher likelihood that red state residents would live in a manufactured home ties in with another one of Realtor’s statistics: states with the most homeowners.
Based on their report, homeownership is highest in red states, where the cost of living is lower.

In Republican-supporting red states, 67.9% of households are homeowners as opposed to the 63.5% figure in Democratic blue states. For example, “Hawaii has the most expensive homes, followed by Washington, DC, and California,” Realtor stated.
“Owning a home is more attainable in red states because the cost difference [in home prices] is substantially more significant than the income difference,” Realtor’s Chief Economist Jonathan Smoke said. “(And) you get more in terms of space.”
While blue areas like the Northeast and California tend to earn higher salaries, homeownership remains more attainable in red states because it only requires their residents to put approximately 26% of their household income towards housing.
In blue states, that percentage of household income going towards housing is closer to 32%.
When someone considers the fact that manufactured homes typically cost about 50% less nationally than new, conventional, site-built housing, that percentage of the household income needed to purchase a manufactured home could dip even lower.

“The cost of housing is directly tied to how much land is available,” Smoke added. “The parts of the country that have an abundance of land have the lowest housing costs.”
End Result?
The results of the study may or may not do anything to shake up the electoral map, but it does offer some perspective in how much money is spent – or not spent – on housing in various parts of the country.
Their broader analysis “was a perfect statement of why there are such differences politically between red and blue states,” Smoke said. “The way of life is clearly different between the two.” ##
(Image credits are as shown above.)

Submitted by Joe Dyton to the Daily Business News, MHProNews.