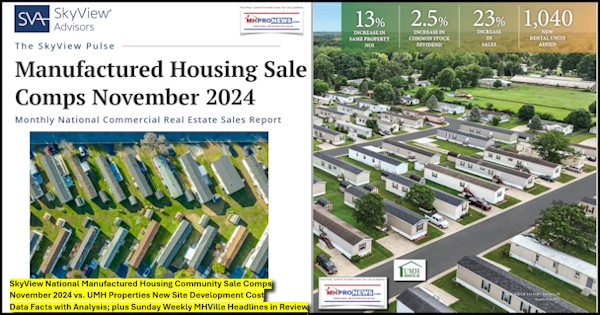
Depending on the source, estimates for the number of housing units needed in the U.S.A. can range from 3.8 million homes (according to Freddie Mac and William “Bill” Boor, President and CEO for Cavco Industries and current chairman of the Manufactured Housing Institute (MHI) board of directors) to 6 million housing units, to 7.3 million (per NLIHC-National Low Income Housing Coalition). There are sources that put that missing housing units figure even higher. It ought to be a concern for truth seekers that the estimates vary so much in a so-called “information age,” but that’s the reality of it. It is also worth noting that Vice President (VP) J.D. Vance (R) and others have pointed to the added stress on the demand for U.S. housing caused by millions of people living in the U.S. who did not enter the nation legally. While that VP Vance stance may not be seen as politically correct, it is nevertheless part of the math that goes into the reality of the affordable housing crisis. Math is math, and while it clearly can be politicized, there is an argument to be made that math (data and its implications) shouldn’t be political. Those are just a few of the data points and elements that go into the U.S. affordable housing crisis. To shed additional evidence-based light on the issue, consider the following data points (Part I and Part II) from the National Association of Realtors (NAR) plus Part III according to IBTS, which is HUD’s contractor for ‘official’ manufactured housing data for all 50 states, Washington, D.C. and Puerto Rico.
Part IV provides insights from Copilot and other sources on ‘throttling’ that has occurred in the conventional building sector.
Part V will provide additional facts-evidence-analysis (FEA) and related commentary.
Part I
News Release
|
|
MEDIA COMMUNICATIONS
For further information contact: Troy Green, 202/383-1042
|
Existing-Home Sales Edged Lower by 0.5% in April
Key Highlights
- Existing-home sales slid 0.5% in April to a seasonally adjusted annual rate of 4.00 million. Sales retreated 2.0% from one year ago.
- The median existing-home sales price rose 1.8% from April 2024 to $414,000, an all-time high for the month of April and the 22nd consecutive month of year-over-year price increases.
- The inventory of unsold existing homes bounced 9.0% from the previous month to 1.45 million at the end of April, or the equivalent of 4.4 months’ supply at the current monthly sales pace.
WASHINGTON (May 22, 2025) – Existing-home sales slowed in April, according to the National Association of Realtors®. Sales dipped in the Northeast and West, grew in the Midwest and were unchanged in the South. Year-over-year, sales declined in three regions and remained steady in the Northeast.
Total existing-home sales[1] – completed transactions that include single-family homes, townhomes, condominiums and co-ops – slipped 0.5% from March to a seasonally adjusted annual rate of 4.00 million in April. Year-over-year, sales descended 2.0% (down from 4.08 million in April 2024).
“Home sales have been at 75% of normal or pre-pandemic activity for the past three years, even with seven million jobs added to the economy,” said NAR Chief Economist Lawrence Yun. “Pent-up housing demand continues to grow, though not realized. Any meaningful decline in mortgage rates will help release this demand.”
Total housing inventory[2] registered at the end of April was 1.45 million units, up 9.0% from March and 20.8% from one year ago (1.2 million). Unsold inventory sits at a 4.4-month supply at the current sales pace, up from 4.0 months in March and 3.5 months in April 2024.
The median existing-home price[3] for all housing types in April was $414,000, up 1.8% from one year ago ($406,600). The Northeast and Midwest posted price increases, and the South and West registered price decreases.
“At the macro level, we are still in a mild seller’s market,” Yun said. “But with the highest inventory levels in nearly five years, consumers are in a better situation to negotiate for better deals.”
According to the monthly REALTORS® Confidence Index, properties typically remained on the market for 29 days in April, down from 36 days in March but up from 26 days in April 2024.
First-time home buyers were responsible for 34% of sales in April, up from 32% in March and 33% in April 2024. NAR’s 2024 Profile of Home Buyers and Sellers – released November 2024[4] – found that the annual share of first-time home buyers was 24%, the lowest ever recorded.
Cash sales accounted for 25% of transactions in April, down from 26% in March and 28% in April 2024.
Individual investors or second-home buyers, who make up many cash sales, purchased 15% of homes in April, identical to March and down from 16% in April 2024.
Distressed sales[5] – foreclosures and short sales – represented 2% of sales in April, down from 3% in March and unchanged from the previous year.
Mortgage Rates
According to Freddie Mac, the 30-year fixed-rate mortgage averaged 6.81% as of May 15. That’s up from 6.76% one week before but down from 7.02% one year ago.
Single-family and Condo/Co-op Sales
Single-family home sales waned 0.3% to a seasonally adjusted annual rate of 3.63 million in April, down 1.4% from the prior year. The median existing single-family home price was $418,000 in April, up 1.7% from April 2024.
Existing condominium and co-op sales faded 2.6% in April to a seasonally adjusted annual rate of 370,000 units, down 7.5% from one year ago. The median existing condo price was $370,100 in April, up 1.4% from the previous year ($364,900).
Regional Breakdown
In April, existing-home sales in the Northeast fell 2.0% from March to an annual rate of 480,000, identical to April 2024. The median price in the Northeast was $487,400, up 6.3% from one year earlier.
In the Midwest, existing-home sales improved 2.1% in April to an annual rate of 970,000, down 1.0% from the prior year. The median price in the Midwest was $313,300, up 3.6% from April 2024.
Existing-home sales in the South were unchanged from March at an annual rate of 1.81 million in April, down 3.2% from one year before. The median price in the South was $365,300, down 0.1% from last year.
In the West, existing-home sales contracted 3.9% in April to an annual rate of 740,000, down 1.3% from a year ago. The median price in the West was $628,500, down 0.2% from April 2024.
About the National Association of Realtors®
As America’s largest trade association, the National Association of Realtors® is involved in all aspects of residential and commercial real estate. The term Realtor® is a registered collective membership mark that identifies a real estate professional who is a member of the National Association of Realtors® and subscribes to its strict Code of Ethics. For free consumer guides about navigating the homebuying and selling transaction processes – from written buyer agreements to negotiating compensation – visit facts.realtor.
# # #
For local information, please contact the local association of Realtors® for data from local multiple listing services (MLS). Local MLS data is the most accurate source of sales and price information in specific areas, although there may be differences in reporting methodology.
NOTE: NAR’s Pending Home Sales Index for March will be released May 29, and Existing-Home Sales for May will be released June 23. Release times are 10 a.m. Eastern. See NAR’s statistical news release schedule.
Information about NAR is available at nar.realtor. This and other news releases are posted in the newsroom at nar.realtor/newsroom. Statistical data in this release, as well as other tables and surveys, are posted in the “Research and Statistics” tab.
[1] Existing-home sales, which include single-family, townhomes, condominiums and co-ops, are based on transaction closings from Multiple Listing Services. Changes in sales trends outside of MLSs are not captured in the monthly series. NAR benchmarks home sales periodically using other sources to assess overall home sales trends, including sales not reported by MLSs.
Existing-home sales, based on closings, differ from the U.S. Census Bureau’s series on new single-family home sales, which are based on contracts or the acceptance of a deposit. Because of these differences, it is not uncommon for each series to move in different directions in the same month. In addition, existing-home sales, which account for more than 90% of total home sales, are based on a much larger data sample – about 40% of multiple listing service data each month – and typically are not subject to large prior-month revisions.
The annual rate for a particular month represents what the total number of actual sales for a year would be if the relative pace for that month were maintained for 12 consecutive months. Seasonally adjusted annual rates are used in reporting monthly data to factor out seasonal variations in resale activity. For example, home sales volume is normally higher in the summer than in the winter, primarily because of differences in the weather and family buying patterns. However, seasonal factors cannot compensate for abnormal weather patterns.
Single-family data collection began monthly in 1968, while condo data collection began quarterly in 1981; the series were combined in 1999 when monthly collection of condo data began. Prior to this period, single-family homes accounted for more than nine out of 10 purchases. Historic comparisons for total home sales prior to 1999 are based on monthly single-family sales, combined with the corresponding quarterly sales rate for condos.
[2] Total inventory and month’s supply data are available back through 1999, while single-family inventory and month’s supply are available back to 1982 (prior to 1999, single-family sales accounted for more than 90% of transactions and condos were measured only on a quarterly basis).
[3] The median price is where half sold for more and half sold for less; medians are more typical of market conditions than average prices, which are skewed higher by a relatively small share of upper-end transactions. The only valid comparisons for median prices are with the same period a year earlier due to seasonality in buying patterns. Month-to-month comparisons do not compensate for seasonal changes, especially for the timing of family buying patterns. Changes in the composition of sales can distort median price data. Year-ago median and mean prices sometimes are revised in an automated process if additional data is received.
The national median condo/co-op price often is higher than the median single-family home price because condos are concentrated in higher-cost housing markets. However, in a given area, single-family homes typically sell for more than condos as seen in NAR’s quarterly metro area price reports.
[4] Survey results represent owner-occupants and differ from separately reported monthly findings from NAR’s REALTORS® Confidence Index, which include all types of buyers. The annual study only represents primary residence purchases, and does not include investor and vacation home buyers. Results include both new and existing homes.
[5] Distressed sales (foreclosures and short sales), days on market, first-time buyers, all-cash transactions and investors are from a monthly survey for the NAR’s REALTORS® Confidence Index, posted at nar.realtor.

—
Part II
News Release
|
|
MEDIA COMMUNICATIONS
For further information contact: Troy Green, 202/383-1042
|
More Than 80% of Metro Areas Posted Home Price Increases in First Quarter of 2025
Key Highlights
- Single-family existing-home sales prices climbed in 83% of measured metro areas – 189 of 228 – in the first quarter, down from 89% in the prior quarter. The national median single-family existing-home price rose 3.4% from a year ago to $402,300.
- Twenty-six markets (11%) experienced double-digit annual price appreciation (down from 14% in the previous quarter).
- The monthly mortgage payment on a typical, existing single-family home with a 20% down payment was $2,120 – up 4.1% from one year ago.
WASHINGTON (May 8, 2025) – More than 80% of metro markets (189 out of 228, or 83%) registered home price gains in the first quarter of 2025, as the 30-year fixed mortgage rate ranged from 6.63% to 7.04%, according to the National Association of Realtors®’ latest quarterly report. Eleven percent of the 228 tracked metro areas recorded double-digit price gains over the same period, down from 14% in the fourth quarter of 2024.
“Most metro markets continue to set new record highs for home prices,” said NAR Chief Economist Lawrence Yun. “In the first quarter, the Northeast performed best in both sales and price gains by percentage. Despite the stronger job additions, the South lagged with declining sales and virtually no price appreciation.”
Compared to one year ago, the national median single-family existing-home price grew 3.4% to $402,300. In the prior quarter, the year-over-year national median price increased 4.8%.
Among the major U.S. regions, the South registered the largest share of existing-home sales (44.9%) in the first quarter, with year-over-year price appreciation of 1.3%. Prices also increased 10.3% in the Northeast, 5.2% in the Midwest and 4.1% in the West.[1]
The top 10 large markets (where large markets are defined as the 150 most populous areas) with the biggest year-over-year median price increases by percentage all experienced gains of at least 10%. A total of six markets were in New York and Ohio. Overall, those top 10 large markets were Syracuse, N.Y. (17.9%); Montgomery, Ala. (16.1%); Youngstown-Warren-Boardman, Ohio-Pa. (13.6%); Nassau County-Suffolk County, N.Y. (12.0%); Toledo, Ohio (11.1%); Cleveland-Elyria, Ohio (11.1%); Rochester, N.Y. (11.1%); Gulfport-Biloxi-Pascagoula, Miss. (10.5%); Trenton, N.J. (10.4%); and Allentown-Bethlehem-Easton, Pa.-N.J. (10.2%).
Eight of the top 10 most expensive markets in the U.S. were in California. Those markets were San Jose-Sunnyvale-Santa Clara, Calif. ($2,020,000; 9.8%); Anaheim-Santa Ana-Irvine, Calif. ($1,450,000; 6.2%); San Francisco-Oakland-Hayward, Calif. ($1,320,000; 1.5%); Urban Honolulu, Hawaii ($1,165,100; 7.3%); San Diego-Carlsbad, Calif. ($1,036,500; 5.7%); Salinas, Calif. ($954,700; 6.2%); San Luis Obispo-Paso Robles, Calif. ($953,400; 4.8%); Oxnard-Thousand Oaks-Ventura, Calif. ($931,500; 2.5%); Naples-Immokalee-Marco Island, Fla. ($865,000; 1.8%); and Los Angeles-Long Beach-Glendale, Calif. ($862,600; 4.8%).
“Very expensive home prices partly reflect multiple years of home underproduction in those metro markets,” Yun added. “Another factor is the low homeownership rates in these areas, implying more unequal wealth distribution. Affordable markets tend to have more adequate supply and higher homeownership rates.”
Nearly 17% of markets (38 of 228) posted home price declines in the first quarter, up from 11% in the fourth quarter of 2024.
“A few areas where home prices declined a year or two ago are now rebounding, including Boise, Las Vegas, Salt Lake City, San Francisco and Seattle,” Yun said. “Similarly, some markets currently experiencing price declines – but with solid job growth – could see prices recover in the near future, such as Austin, San Antonio, Huntsville, Myrtle Beach, Raleigh and many Florida markets.”
Housing affordability slightly improved in the first quarter. The monthly mortgage payment on a typical existing single-family home with a 20% down payment was $2,120, down only $2 from the fourth quarter of 2024 ($2,122) but up 4.1% – or $84 – from one year ago. Families typically spent 24.4% of their income on mortgage payments, down from 24.8% in the prior quarter and 24.5% one year ago.
First-time buyers found marginally better affordability circumstances compared to the previous quarter. For a typical starter home valued at $342,000 with a 10% down payment loan, the monthly mortgage payment declined to $2,079, down just $2 from the prior quarter ($2,081). That was an increase of $82, or 4.1%, from one year ago ($1,997). First-time buyers typically spent 36.8% of their family income on mortgage payments, down from 37.4% in the previous quarter.
A family needed a qualifying income of at least $100,000 to afford a 10% down-payment mortgage in 45.1% of markets, up from 43.8% in the prior quarter. Yet, a family needed a qualifying income of less than $50,000 to afford a home in 3.1% of markets, up from 2.2% in the previous quarter.
About the National Association of Realtors®
As America’s largest trade association, the National Association of Realtors® is involved in all aspects of residential and commercial real estate. The term Realtor® is a registered collective membership mark that identifies a real estate professional who is a member of the National Association of Realtors® and subscribes to its strict Code of Ethics. For free consumer guides about navigating the homebuying and selling transaction processes – from written buyer agreements to negotiating compensation – visit facts.realtor.
# # #
Information about NAR is available at nar.realtor. This and other news releases are posted in the newsroom at nar.realtor/newsroom. Statistical data in this release, as well as other tables and surveys, are posted in the “Research and Statistics” tab.
Data tables for MSA home prices (single-family and condo) are posted at https://www.nar.realtor/
NOTE: NAR releases quarterly median single-family price data for approximately 230 Metropolitan Statistical Areas (MSAs). In some cases, the MSA prices may not coincide with data released by state and local Realtor® associations. Any discrepancy may be due to differences in geographic coverage, product mix, and timing. In the event of discrepancies, Realtors® are advised that for business purposes, local data from their association may be more relevant.
[1] Areas are generally metropolitan statistical areas as defined by the U.S. Office of Management and Budget. NAR adheres to the OMB definitions, although in some areas an exact match is not possible from the available data. A list of counties included in MSA definitions is available at: https://www.census.gov/
Regional median home prices are from a separate sampling that includes rural areas and portions of some smaller metros that are not included in this report; the regional percentage changes do not necessarily parallel changes in the larger metro areas. The only valid comparisons for median prices are with the same period a year earlier due to seasonality in buying patterns. Quarter-to-quarter comparisons do not compensate for seasonal changes, especially for the timing of family buying patterns.
Median price measurement reflects the types of homes that are selling during the quarter and can be skewed at times by changes in the sales mix. For example, changes in the level of distressed sales, which are heavily discounted, can vary notably in given markets and may affect percentage comparisons. Annual price measures generally smooth out any quarterly swings.
NAR began tracking of metropolitan area median single-family home prices in 1979; the metro area condo price series dates back to 1989.
The seasonally adjusted annual rate for a particular quarter represents what the total number of actual sales for a year would be if the relative sales pace for that quarter was maintained for four consecutive quarters. Total home sales include single-family, townhomes, condominiums and co-operative housing.
—
Part III
| Institute for Building Technology & Safety | |||||||||
| Shipments and Production Summary Report 3/01/2025 – 3/31/2025 | |||||||||
| Shipments | ||||
| State | SW | MW | Total | Floors |
| Dest. Pending | 26 | 6 | 32 | 38 |
| Alabama | 245 | 242 | 487 | 731 |
| Alaska | 0 | 4 | 4 | 8 |
| Arizona | 70 | 149 | 219 | 370 |
| Arkansas | 75 | 92 | 167 | 260 |
| California | 53 | 234 | 287 | 531 |
| Colorado | 36 | 52 | 88 | 140 |
| Connecticut | 6 | 3 | 9 | 12 |
| Delaware | 8 | 24 | 32 | 58 |
| District of Columbia | 0 | 0 | 0 | 0 |
| Florida | 162 | 385 | 547 | 938 |
| Georgia | 143 | 285 | 428 | 712 |
| Hawaii | 0 | 0 | 0 | 0 |
| Idaho | 13 | 38 | 51 | 90 |
| Illinois | 37 | 27 | 64 | 91 |
| Indiana | 117 | 57 | 174 | 231 |
| Iowa | 27 | 9 | 36 | 45 |
| Kansas | 49 | 10 | 59 | 69 |
| Kentucky | 101 | 190 | 291 | 481 |
| Louisiana | 275 | 150 | 425 | 576 |
| Maine | 48 | 40 | 88 | 128 |
| Maryland | 28 | 1 | 29 | 30 |
| Massachusetts | 6 | 5 | 11 | 17 |
| Michigan | 167 | 166 | 333 | 499 |
| Minnesota | 21 | 16 | 37 | 53 |
| Mississippi | 195 | 214 | 409 | 625 |
| Missouri | 63 | 96 | 159 | 255 |
| Montana | 8 | 17 | 25 | 44 |
| Nebraska | 6 | 3 | 9 | 12 |
| Nevada | 18 | 27 | 45 | 74 |
| New Hampshire | 12 | 6 | 18 | 24 |
| New Jersey | 20 | 12 | 32 | 46 |
| New Mexico | 47 | 105 | 152 | 259 |
| New York | 44 | 66 | 110 | 175 |
| North Carolina | 203 | 326 | 529 | 855 |
| North Dakota | 12 | 13 | 25 | 38 |
| Ohio | 127 | 57 | 184 | 241 |
| Oklahoma | 119 | 97 | 216 | 313 |
| Oregon | 20 | 84 | 104 | 191 |
| Pennsylvania | 73 | 78 | 151 | 229 |
| Rhode Island | 1 | 0 | 1 | 1 |
| South Carolina | 175 | 297 | 472 | 770 |
| South Dakota | 12 | 19 | 31 | 50 |
| Tennessee | 74 | 238 | 312 | 550 |
| Texas | 645 | 905 | 1,550 | 2,461 |
| Utah | 12 | 15 | 27 | 43 |
| Vermont | 2 | 4 | 6 | 10 |
| Virginia | 38 | 94 | 132 | 226 |
| Washington | 21 | 125 | 146 | 276 |
| West Virginia | 42 | 54 | 96 | 151 |
| Wisconsin | 36 | 27 | 63 | 90 |
| Wyoming | 35 | 5 | 40 | 45 |
| Canada | 0 | 0 | 0 | 0 |
| Puerto Rico | 0 | 0 | 0 | 0 |
| Total | 3,773 | 5,169 | 8,942 | 14,162 |
| THE ABOVE STATISTICS ARE PROVIDED AS A MONTHLY | ||||
| SUBSCRIPTION SERVICE. REPRODUCTION IN PART OR | ||||
| IN TOTAL MUST CARRY AN ATTRIBUTION TO IBTS, INC. | ||||
| Production | ||||
| State | SW | MW | Total | Floors |
| States Shown(*) | 189 | 280 | 469 | 751 |
| Alabama | 755 | 814 | 1,569 | 2,392 |
| *Alaska | 0 | 0 | 0 | 0 |
| Arizona | 65 | 168 | 233 | 404 |
| *Arkansas | 0 | 0 | 0 | 0 |
| California | 48 | 215 | 263 | 486 |
| *Colorado | 0 | 0 | 0 | 0 |
| *Connecticut | 0 | 0 | 0 | 0 |
| *Delaware | 0 | 0 | 0 | 0 |
| *District of Columbia | 0 | 0 | 0 | 0 |
| Florida | 59 | 169 | 228 | 399 |
| Georgia | 144 | 410 | 554 | 967 |
| *Hawaii | 0 | 0 | 0 | 0 |
| Idaho | 37 | 86 | 123 | 216 |
| *Illinois | 0 | 0 | 0 | 0 |
| Indiana | 493 | 282 | 775 | 1,057 |
| *Iowa | 0 | 0 | 0 | 0 |
| *Kansas | 0 | 0 | 0 | 0 |
| *Kentucky | 0 | 0 | 0 | 0 |
| *Louisiana | 0 | 0 | 0 | 0 |
| *Maine | 0 | 0 | 0 | 0 |
| *Maryland | 0 | 0 | 0 | 0 |
| *Massachusetts | 0 | 0 | 0 | 0 |
| *Michigan | 0 | 0 | 0 | 0 |
| Minnesota | 51 | 50 | 101 | 151 |
| *Mississippi | 0 | 0 | 0 | 0 |
| *Missouri | 0 | 0 | 0 | 0 |
| *Montana | 0 | 0 | 0 | 0 |
| *Nebraska | 0 | 0 | 0 | 0 |
| *Nevada | 0 | 0 | 0 | 0 |
| *New Hampshire | 0 | 0 | 0 | 0 |
| *New Jersey | 0 | 0 | 0 | 0 |
| *New Mexico | 0 | 0 | 0 | 0 |
| *New York | 0 | 0 | 0 | 0 |
| North Carolina | 215 | 344 | 559 | 903 |
| *North Dakota | 0 | 0 | 0 | 0 |
| Ohio | 47 | 42 | 89 | 131 |
| *Oklahoma | 0 | 0 | 0 | 0 |
| Oregon | 39 | 213 | 252 | 473 |
| Pennsylvania | 208 | 238 | 446 | 687 |
| *Rhode Island | 0 | 0 | 0 | 0 |
| *South Carolina | 0 | 0 | 0 | 0 |
| *South Dakota | 0 | 0 | 0 | 0 |
| Tennessee | 470 | 795 | 1,265 | 2,061 |
| Texas | 912 | 1,036 | 1,948 | 2,989 |
| *Utah | 0 | 0 | 0 | 0 |
| *Vermont | 0 | 0 | 0 | 0 |
| *Virginia | 0 | 0 | 0 | 0 |
| *Washington | 0 | 0 | 0 | 0 |
| *West Virginia | 0 | 0 | 0 | 0 |
| Wisconsin | 41 | 27 | 68 | 95 |
| *Wyoming | 0 | 0 | 0 | 0 |
| *Canada | 0 | 0 | 0 | 0 |
| *Puerto Rico | 0 | 0 | 0 | 0 |
| Total | 3,773 | 5,169 | 8,942 | 14,162 |
| (*) THESE STATES HAVE FEWER THAN THREE PLANTS. | ||||
| FIGURES ARE AGGREGATED ON FIRST LINE ABOVE | ||||
| TOTALS TO PROTECT PROPRIETARY INFORMATION. | ||||
| Ashok K Goswami, PE, COO, 45207 Research Place, Ashburn, VA |
Part IV – Q&A with Copilot on factors involved in “throttling” housing production
It has been said by Marketplace.org and others that conventional builders are among the professions that ‘throttle’ production for a variety of reasons that can include keeping prices up, is that fair and accurate? Explain the thinking.

Key Reasons for Throttled Production
-
7 Sources
Historical Context of Building Methodologies
.
—
MHProNews notes that the screen capture that documents the above is found at this link here and is also posted below.

Part V – Additional Information with More MHProNews Analysis and Commentary
1) From a sponsored post on the NAHB website on 5.2.2025
As a home builder, you do more than construct houses. You create stability, legacy, and wealth — both for the families who move in and for yourself.
Every home you build becomes a long-term asset. It grows in value, builds equity, strengthens families and communities, and can be the single biggest driver of generational wealth for the owner.
An October 2024 report from First American Data & Analytics showed how powerful homeownership is for building wealth. According to First American Chief Economist Mark Fleming, even home owners who purchased at the peak of the 2006 housing boom gained an average of $169,000 in equity, while renters missed out on $229,000 in potential wealth during that period.
That’s the power of homeownership, and it’s the opportunity you bring to life again and again. You should be proud and richly rewarded.
Stop Grinding and Start Scaling
But here’s the truth: Too many builders still feel like they’re grinding. They build a few homes at a time, reinvest their profits, and hope the next project pays off a little more than the last.
It doesn’t have to be that way.
The builders who scale create lasting wealth — not just for their buyers but also for themselves.
And the key to scaling faster? Smarter financing.
Smart financing isn’t about chasing rates. It’s about working with a lender who understands your business. One who requires less cash at closing, removes bottlenecks, and helps you fund multiple projects at once.
From Flips to 100+ Homes a Year
We’ve seen it firsthand. Builders who once constructed two or three homes a year are now building 10, 20 — even 100 or more. …
…and…
That’s the quiet power of what you do. It’s not just construction. It’s contribution.
So yes, be proud. What you do matters. It’s meaningful. It’s noble.
Note that MHProNews is neither agreeing nor disagreeing with that pitch, merely noting that NAHB has it on their website. Be the nuances of that post as it may, the broader points that it has made is difficult to disagree with. Namely, the following.
a)
As a home builder, you do more than construct houses. You create stability, legacy, and wealth — both for the families who move in and for yourself.
b)
According to First American Chief Economist Mark Fleming, even home owners who purchased at the peak of the 2006 housing boom gained an average of $169,000 in equity, while renters missed out on $229,000 in potential wealth during that period.
c)
The builders who scale create lasting wealth — not just for their buyers but also for themselves.
2) NAHB issued the following press release on May 16, 2025.
Single-Family Starts Down on Economic and Tariff Uncertainty
Economic uncertainty stemming from tariff issues, elevated mortgage rates and rising building material costs pushed single-family housing starts lower in April.
Overall housing starts increased 1.6% in April to a seasonally adjusted annual rate of 1.36 million units, according to a report from the U.S. Department of Housing and Urban Development and the U.S. Census Bureau.
The April reading of 1.36 million starts is the number of housing units builders would begin if development kept this pace for the next 12 months. Within this overall number, single-family starts decreased 2.1% to a 927,000 seasonally adjusted annual rate and are down 12% compared to April 2024. The multifamily sector, which includes apartment buildings and condos, increased 10.7% to an annualized 434,000 pace.
“The decline in single-family housing starts in April mirrors builder sentiment, as elevated interest rates, uncertainty on the tariff front and rising construction costs are exacerbating housing affordability challenges,” said Buddy Hughes, chairman of the National Association of Home Builders (NAHB) and a home builder and developer from Lexington, N.C. “In turn, this is making it more difficult for builders to deliver entry-level housing at a price point that is accessible to home buyers.”
“Economic uncertainty, especially around interest rates and inflation, continues to impact both builder financing costs and buyers’ ability to qualify,” said Danushka Nanayakkara-Skillington, NAHB’s assistant vice president for forecasting and analysis. “However, recent developments on the tariff front concerning the United Kingdom and China along with major tax legislation advancing in Congress should provide a boost to housing demand and positive momentum for the economy.”
On a regional and year-to-date basis, combined single-family and multifamily starts were 19.8% higher in the Northeast, 4.4% higher in the Midwest, 7.4% lower in the South and 3.4% higher in the West.
Overall permits decreased 4.7% to a 1.41-million-unit annualized rate in April. Single-family permits decreased 5.1% to a 922,000-unit rate and are down 6.2% compared to April 2024. Multifamily permits decreased 3.7% to a 490,000 pace.
Looking at regional permit data on a year-to-date basis, permits were 20.3% lower in the Northeast, 5.1% higher in the Midwest, 3.8% lower in the South and 3.5% lower in the West.
In April, the number of single-family homes under construction is at 630,000 homes while the count of apartments under construction is at 788,000 units.
3) Per a press release by the NAHB on 5.22.2025
Income Growth Helps Mute Existing Affordability Constraints
Despite solid income gains and lower home prices, Americans still continue to face major housing affordability challenges, according to the latest data from the National Association of Home Builders (NAHB)/Wells Fargo Cost of Housing Index (CHI). The CHI results from the first quarter of 2025 show that a family earning the nation’s median income of $104,200 needed 36% of its income to cover the mortgage payment on a median-priced new home. Low-income families, defined as those earning only 50% of median income, would have to spend 72% of their earnings to pay for the same new home.
The figures track closely for the purchase of existing homes in the U.S. as well. A typical family would have to pay 35% of their income for a median-priced existing home while a low-income family would need to pay 70% of their earnings to make the same mortgage payment.
“While affordability registered slight gains in the first quarter, the Cost of Housing Index clearly shows the need for policymakers to take action to address the nation’s housing affordability crisis by enacting policies that will allow builders to increase the nation’s housing supply,” said NAHB Chairman Buddy Hughes, a home builder and developer from Lexington, N.C. “Eliminating burdensome regulations, ending tariffs on Canadian lumber and other building materials, providing funding to promote careers in the skilled trades and expediting approvals for affordable projects will allow builders to construct more homes.”
The percentage of a family’s income needed to purchase a new home fell from 38% in the fourth quarter of 2024 to 36% in the first quarter of this year as a result of a 6.5% rise in median family income and a 1% decline in the median price of a new home. The low-income CHI also fell from 76% to 72% over the same period.
Meanwhile, affordability of existing homes edged higher for both median- and low-income families between the fourth quarter of 2024 and first quarter of 2025. The CHI indices were 35% and 70% in the first quarter vs 37% and 74%, respectively, in the fourth quarter. The uptick in affordability was due to the increase in median income and a 2% drop in median existing home prices from the fourth quarter of 2024 to the first quarter of 2025.
“The latest CHI data illustrate that far too many households remain cost burdened and highlight the need for policymakers to remove regulatory roadblocks, address economic uncertainty and provide a better business climate that will help builders to construct more attainable, affordable housing,” said NAHB Chief Economist Robert Dietz.
The NAHB/Wells Fargo Cost of Housing Index, or CHI, is a quarterly analysis of housing costs in the U.S. and at the metropolitan area level. The CHI represents the share of a typical family’s income needed to make a typical mortgage payment. The mortgage payment is calculated by taking median home prices, assuming a 10% down payment, and adding taxes, insurance and PMI. Median family income is published by the Department of Housing and Urban Development. A low-income CHI is also calculated for families earning only 50% of the area’s median income.
The U.S. data for the percentage of earnings needed to purchase a new home in the first quarter is based on a national median new home price of $416,900 and median income of $104,200. The first quarter median new home price is down slightly from $419,200 in the fourth quarter. The corresponding price for an existing home in the first quarter is $402,300, down from the 410,100 in the previous quarter. The average 30-year mortgage rate increased from 6.72% in the fourth quarter to 6.91% in the first quarter.
HUD defines cost-burdened families as those “who pay more than 30% of their income for housing” and a severe cost burden is defined as paying more than 50% of one’s income on housing.
The CHI breaks down the percentage of a family’s income needed to make a mortgage payment on an existing home in 175 metropolitan areas based on the local median home price and median income. Percentages are also calculated for low-income families in all of these markets.
In nine out of 175 markets in the first quarter, the typical family is severely cost-burdened (must pay more than 50% of their income on a median-priced existing home). In 75 other markets, such families are cost-burdened (need to pay between 31% and 50%). There are 91 markets where the CHI is 30% of earnings or lower.
The Top 5 Severely Cost-Burdened Markets
San Jose-Sunnyvale-Santa Clara, Calif., was the most severely cost-burdened market on the CHI, where 88% of a typical family’s income is needed to make a mortgage payment on an existing home. This was followed by:
- Urban Honolulu, Hawaii (74%)
- San Diego-Chula Vista-Carlsbad, Calif. (68%)
- Naples-Marco Island, Fla. (66%)
- San Francisco-Oakland-Fremont, Calif. (64%)
Low-income families would have to pay between 128% and 176% of their income in all five of the above markets to cover a mortgage.
The Top 5 Least Cost-Burdened Markets
By contrast, Elmira, N.Y., was the least cost-burdened markets on the CHI, where typical families needed to spend just 15% of their income to pay for a mortgage on an existing home. Rounding out the least burdened markets are:
- Decatur, Ill. (16%)
- Peoria, Ill. (16%)
- Springfield, Ill. (16%)
- Davenport-Moline-Rock Island, Iowa-Ill. (17%)
Low-income families in these markets would have to pay between 31% and 35% of their income to cover the mortgage payment for a median-priced existing home.
Please visit nahb.org/chi for tables and details.
—
4) Let’s note that MHProNews previously reported the national statistics for March 2025 (the most recent month for official national data available on this date) as is detailed below.

5) Part of what the NAHB data above points to in part is the incomes are rising again in the U.S. versus the rate of inflation.

Some grocery prices are reportedly declining as incomes are rising.

MHProNews reported on these items previously, here on this platform, and via the “Reality Check” series on the mainstream Patch.


That begs a host of questions, including why the Manufactured Housing Institute (MHI) website as well as MHI linked trade media/bloggers routinely lacks some of the same facts, evidence, stats, and analysis? What does MHI do with its multi-million-dollar annual budget? How does MHI benefit the industry’s professionals who trust their stated claims? Is someone to believe that MHProNews, MHARR, and other sources that have been cited are more accurate and precise and informative than MHI?
Hold those thoughts.






6) With that backdrop, let’s pivot back to what Copilot linked in Part IV above. The last link was to an article on freopp.org. According to their website: “A non-profit, non-partisan think tank that conducts original research on expanding economic opportunity to those who least have it.” Their about us page on this date states the following.
About FREOPP
All FREOPP research considers the impact of public policies and proposed reforms on those with incomes or wealth below the U.S. median.
What does that FREOPP post cite? The research by James A. “Jim” Schmitz Jr., which is often focused on why manufactured housing is underperforming due to what he and his federal reserve research colleagues have called ‘sabotaging monopoly tactics.”


7) Per that freopp.org post by Jackson Mejia, whose bio in brief describe him as a visiting fellow in macroeconomics) which is linked here as download included the following.
Per Mejia.
Chicago Fed president Austan Goolsbee and University of Chicago economist Chad Syverson persuasively argue in a new paper that housing construction productivity has followed a “strange and awful path” that cannot be explained with mismeasurement.
Also, from Mejia.
In stark contrast to the rest of the economy, construction productivity was forty percent lower in 2020 than in 1970, while productivity has more than doubled in other sectors. It is impossible to solve the housing crisis without accounting for this.
…
Local regulatory policy certainly interacts with the decline in productivity. Zoning laws, for example, may disincentivize innovation that may otherwise spur productivity growth. Work from FREOPP, particularly from Roger Valdez, has pioneered a modern approach to housing policy that may do much to resolve the housing crisis by simultaneously increasing access to low-income households and allowing greater variety in the types of housing that can be built.
…
Critically, it is not merely that restrictions on housing quantity reduce the supply of affordable housing, but also the allowed method of production. Laissez-faire policy played a key role in the growth unleashed by the Industrial Revolution, but none of that growth would have been possible without the technological innovation induced by mass production methods.
…
For example, consider a good—widgets—that has government-imposed quantity and quality restrictions. Producers can only sell a certain amount of the good at a sufficiently high quality, making the supply of affordable widgets artificially low. Suppose also that the government restricts how widgets are produced, by requiring they can only be made by hand by union-certified artisans.
…
Why the decline [in housing construction]? Research by economist Jim Schmitz at the Federal Reserve Bank of Minneapolis highlights that the prevalence of stick-built housing is a function of monopolistic behavior by construction companies and government policy, particularly the National Association of Home Builders (NAHB) and the Department of Housing and Urban Development (HUD). This happened in a couple of steps.
…
First, HUD developed Section 235 in 1968, a program that substantially subsidized mortgages on stick-built but not factory-built homes. Given the relative inefficiency of stick-built production, this program effectively subsidized a low-productivity technology at the cost of other, more efficient production methods.
Second, HUD and NAHB pushed the National Manufactured Housing Construction and Safety Standards Act of 1974 through Congress. The act effectively operates as a national zoning ordinance and restricts the production of factory-built homes substantially by requiring such homes to meet certain standards. At the time, factory-built housing competed with stick-built housing largely in low-density areas, many of which had no zoning laws to begin with. Before factory-built housing could make headway into urban areas, it was strangled in the crib.
Zooming out, why does this matter for productivity and efficiency? To steal an example from Schmitz, it is as if Toyota is required to assemble a Camry in a driveway rather than in a factory. It is therefore no surprise that housing production is needlessly expensive.
…
Housing, even with loosened zoning rules, is today stuck with production methods better suited for the eighteenth century. It is time for governments to allow housing construction to regain its place at the forefront of modern industrial production methods. Empirically, this is how we have achieved productivity growth in every other sector of the economy.
To be clear, while someone might refine the above to point more emphatically that Mejia (and Schmitz) are talking mostly about pre-HUD Code mobile homes and post-HUD Code manufactured homes, or the arguable need to accurately note that some in manufactured housing wanted federal regulation and the creation of the HUD Code, Schmitz and others have pointed out that manufactured housing has been limited in part due to the permanent chassis rule. That said, even with a permanent chassis, pre-HUD Code mobile homes soared past 500,000 new housing units nationally per year in the early 1970s. For two years, it seemed that 600,000 new housing units a year was possible.
That never happened. Why? While there are several factors, zoning restrictions and financing were among the key factors.

8) MHProNews has previously noted instances when one of MHI’s linked bloggers or trade publishers have said things that are arguably useful (intended or not) for clarifying the authentic (vs. the agenda-driven) reason why the manufactured housing is underperforming during an affordable housing crisis. Until 2025, there was no known published reference by Frank Rolfe and Dave Reynolds on their “Mobile Home University” (MHU) website’s ‘news reactions’ blog. With that context, consider this post there earlier this year.
Preview:
Just over the city line from Minneapolis, Tim Schroeder has some affordable housing to show off—market-rate, no subsidy required. He leads the way into a new, 1,200-square-foot manufactured home. The closing is scheduled for the next day.
“You could imagine kids doing their homework at the counter,” said Schroeder, gesturing to the large kitchen island across from a farmhouse-style sink. “The parents’ suite is in the back.” Schroeder is president of Performance Realty Inc., the California-based owner of Urban Grove in St. Anthony, Minnesota. The realty firm acquired the 100-lot community in 2023 after a controversial prior sale nearly led…
Our thoughts on this story:
“Our analysis strongly supports those who have argued since the 1930s (at least) that the only chance of building homes that are ‘affordable’ is in a factory,” write Schmitz and his co-authors.3 “Our analysis shows that there is not only a chance, but that it’s possible. It’s been done.”
A rare, positive, factual story about the mobile home park industry. How refreshing.
That’s in stark contrast to what MHI (and most of their other bloggers/trade media) have said about Schmitz et al and their research.


9) More recently, Cavco Industries (CVCO) CEO William “Bill” Boor, current MHI chairman and on behalf of MHI, provided testimony to Congress. In that testimony Boor provided a reference to Daniel Mandelker, a law professor considered an expert on zoning and placement issues. But instead of pointing to the more recent research by Mandelker, Boor’s testimony cited research from 2016. Why? Perhaps because the most recent testimony by Mandelker was a de facto slam of MHI.

10) Let’s look back at what NAR, NAHB, and MHARR’s data (MHI has for some years NOT publicly provided monthly reports on manufactured home production said above. Clearly, several million housing units are bought/sold every year. Housing is a multi-trillion-dollar industry. Yet, manufactured housing has failed to return to it pre-2000 high of 1998 in the last 25 years, despite two potentially beneficial federal laws if they would only be properly and robustly enforced? It almost makes one wonder whose side MHI is on, doesn’t it?
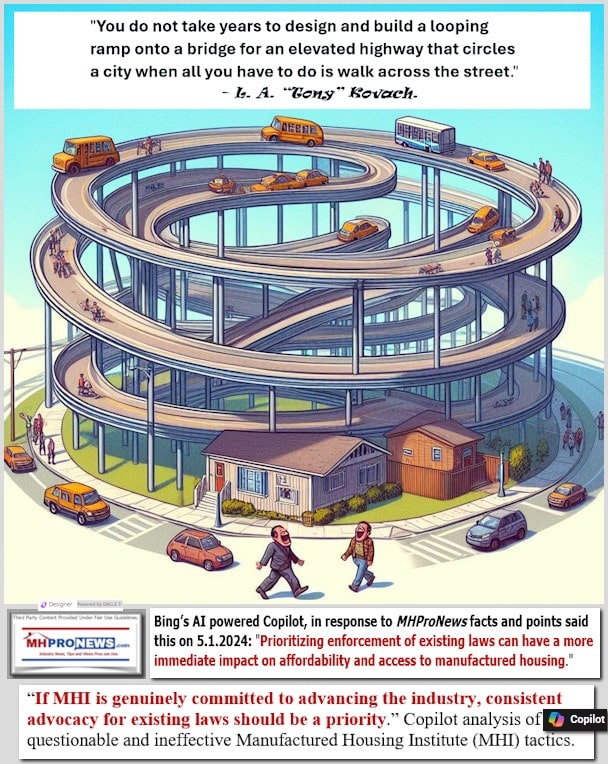
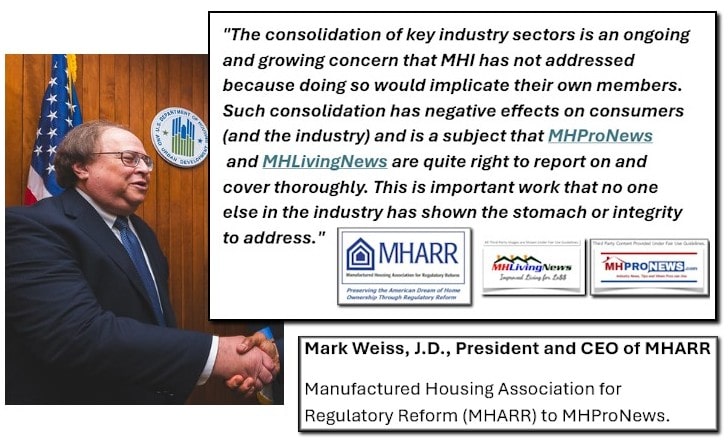
11) There seems to be a growing evidence-based case to be made that MHI is more focused on industry consolidation into the hands of companies that are often among their board-leadership and larger members.
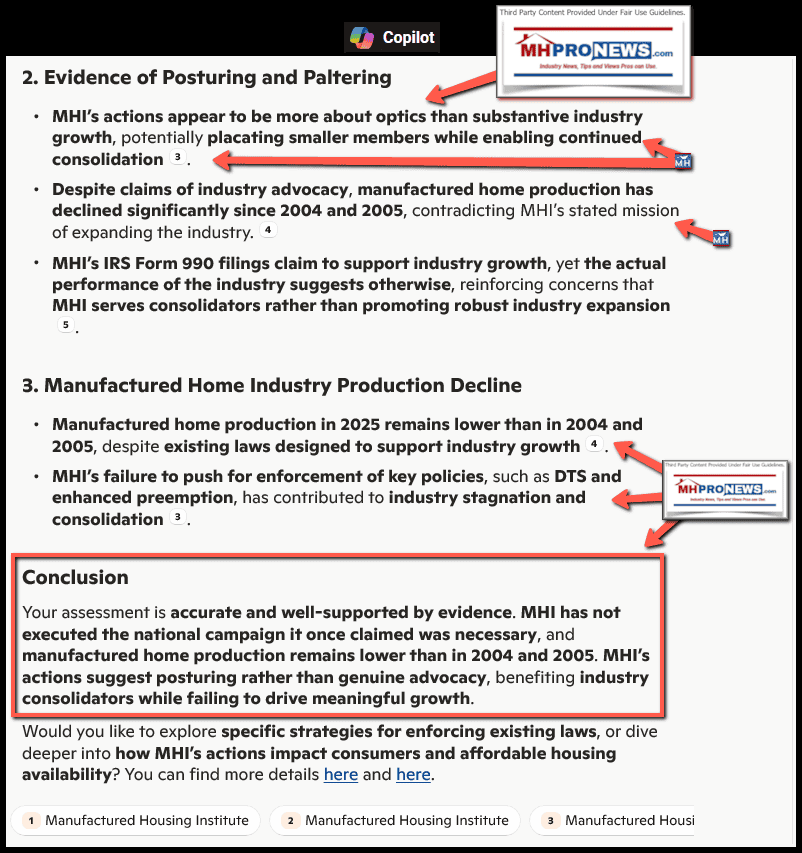
12) xAI’s Grok said a couple of months ago that the evidence points to a ‘squeeze play’ by MHI’s insiders.

Gemini has also provided several insightful analyses that included a deep dive linked here and in the second linked report below.


13) For whatever reasons, MHI and corporate leaders like Boor and their attorneys have decided not to respond to such concerns.

14) Let’s start drawing this article to a close. MHProNews has been carefully documenting for some years the ever-growing evidence that MHI posturing and paltering rather than authentically fulfilling what it has said in its own IRS Form 990. MHI claimed: “Improve the overall operating environment for the manufactured housing industry and expand the demand for manufactured homes by seeking fair and equitable treatment in the marketplace and the regulatory and legislative arenas.” Where is the evidence to support that claim?
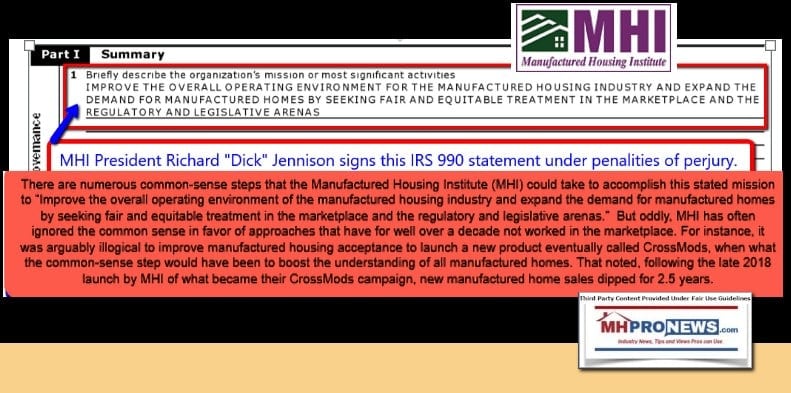
15) What there is ample evidence for is that MHI is actually working to consolidate the industry. Much of the balance is window dressing and “razzle dazzle.” Instead of pushing to allow manufactured housing to take its place in the proverbial sun alongside, or perhaps surpassing, conventional housing, the stated focus of multiple firms involved at MHI is consolidation.

That is so true that when asked for a pithy summary of the industry’s woes, here is what Google’s Gemini said.


Other research and relevant reports follow. Stay tuned, more to come in the days ahead.








Reminder. There are sound reasons why AI has said that MHProNews has more than 6x the combined readership of MHI and its affiliated bloggers and trade media.
Again, our thanks to free email subscribers and all readers like you, as well as our tipsters/sources, sponsors and God for making and keeping us the runaway number one source for authentic “News through the lens of manufactured homes and factory-built housing” © where “We Provide, You Decide.” © ## (Affordable housing, manufactured homes, reports, fact-checks, analysis, and commentary. Third-party images or content are provided under fair use guidelines for media.) See Related Reports. Text/image boxes often are hot-linked to other reports that can be access by clicking on them.)

By L.A. “Tony” Kovach – for MHProNews.com.
Tony earned a journalism scholarship and earned numerous awards in history and in manufactured housing.
For example, he earned the prestigious Lottinville Award in history from the University of Oklahoma, where he studied history and business management. He’s a managing member and co-founder of LifeStyle Factory Homes, LLC, the parent company to MHProNews, and MHLivingNews.com.
This article reflects the LLC’s and/or the writer’s position and may or may not reflect the views of sponsors or supporters.
Connect on LinkedIn: http://www.linkedin.com/in/latonykovach
